We collaborate to achieve sustainable success
A leading environmental solution provider
Get in touch with usAFS Energy EU ETS Report Week 50 2025

Do you want to receive to-the-minute up to date info? Please sign up to our client portal and/or to the Viridian Exchange.
European gas storage at 72.8% and warmer-than-expected weather keep near-term demand subdued, aligning with the TTF front month sliding to 20-month lows. At the same time, the Dec25 options expiry shows heavy call interest around €80–85, hinting at where larger players may want to keep the tape in play. Analysts remain split on LNG oversupply risks, which keeps the broader balance sheet far from clear. Policy signals pull both ways: the EU aims to finalize a Russian gas ban, while TenneT’s push to keep 1.2 GW of Dutch gas units running until 2032 underscores the system’s continued reliance on gas. Stricter scrutiny on fossil projects, Germany’s cost concerns, and accelerating EU funding, over €10B for net-zero, hydrogen, SAF, and industrial decarbonization, all add complexity to the forward curve. Across the Atlantic, analysts noting U.S. gas holding above $5/MMBtu adds another layer to cross-basin sentiment, though opinions remain far from aligned.
Plenty of arguments for both upside and downside: soft fundamentals vs. firm options interest, mild weather vs. shifting policy, and uncertain LNG flows vs. steady structural demand. Tape stays open to interpretation.
Auction volume: 13.66 million EUAs, 2.16 more than last week
Energy Fundamentals
- Gas storage currently sits at 72.8% (Dec 5, 2025)
- Warmer than expected weather in Europe
- Dec25 options expiry on Dec 10, biggest call OI split between 80 and 85 strike
- TTF front month dropped to the lowest level’s on Friday in the past 20 months
- Analysts split over LNG oversupply risks and EU gas price impact
- Tennet wants 4 Dutch gas units (1.2 GW) to run until 2032
- EU aims to adopt Russian gas ban rule by year end
- Analysts See More Upside as Natural Gas Futures Hold Firmly Above $5/MMbtu
- Fossil fuel projects face stricter scrutiny after Europe’s top human rights court ruling
- Germany's energy transition: Are costs for customers spiralling out of control?
- €5.2 billion of EU Emissions Trading revenues earmarked for clean transition technologies under the Innovation Fund
- EU launches Early Movers’ Coalition to accelerate sustainable aviation fuel uptake
- EU Commits More than €5 Billion to Net Zero Tech, Hydrogen, Industrial Decarbonization Projects
Investment Funds
- Investment funds increased their net long position to +109.78m EUAs on November 28th (vs. +101.04m EUAs on November 21st).
- Gross short positions slightly decreased to -28.88m EUAs (vs -29.57m EUAs).
- Gross long positions increased to 138.66m EUAs (vs. 130.62m EUAs).
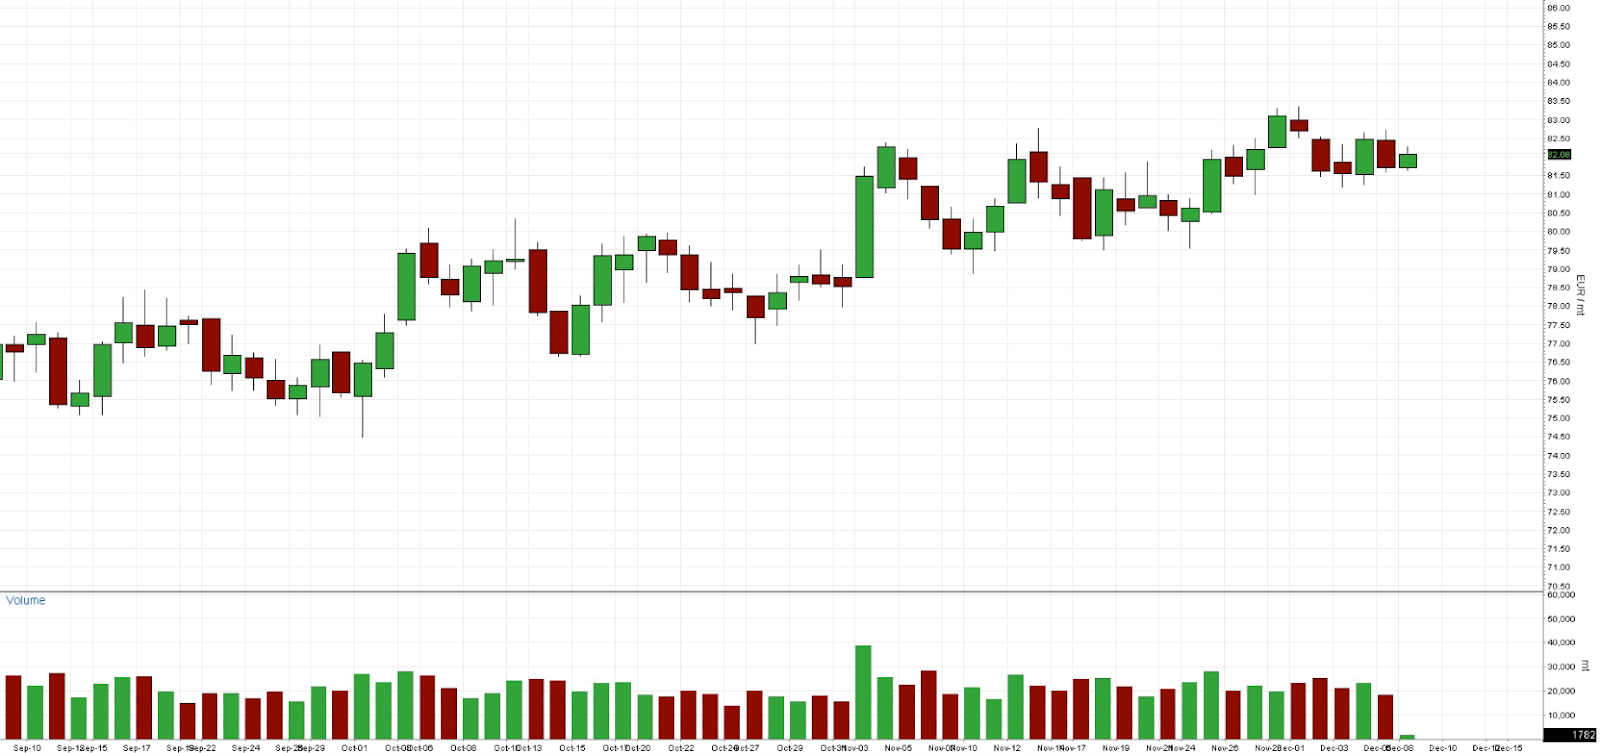
Market Prices:
- Indicative Dec25 EUA Price: € 82.08
- Indicative Spot EUA Price: €82.05
- YTD Spot EUA Price: € 73.212
- MTD Spot EUA Price: € 82.072
Chart A: December 2025 EUA Price (EUR)
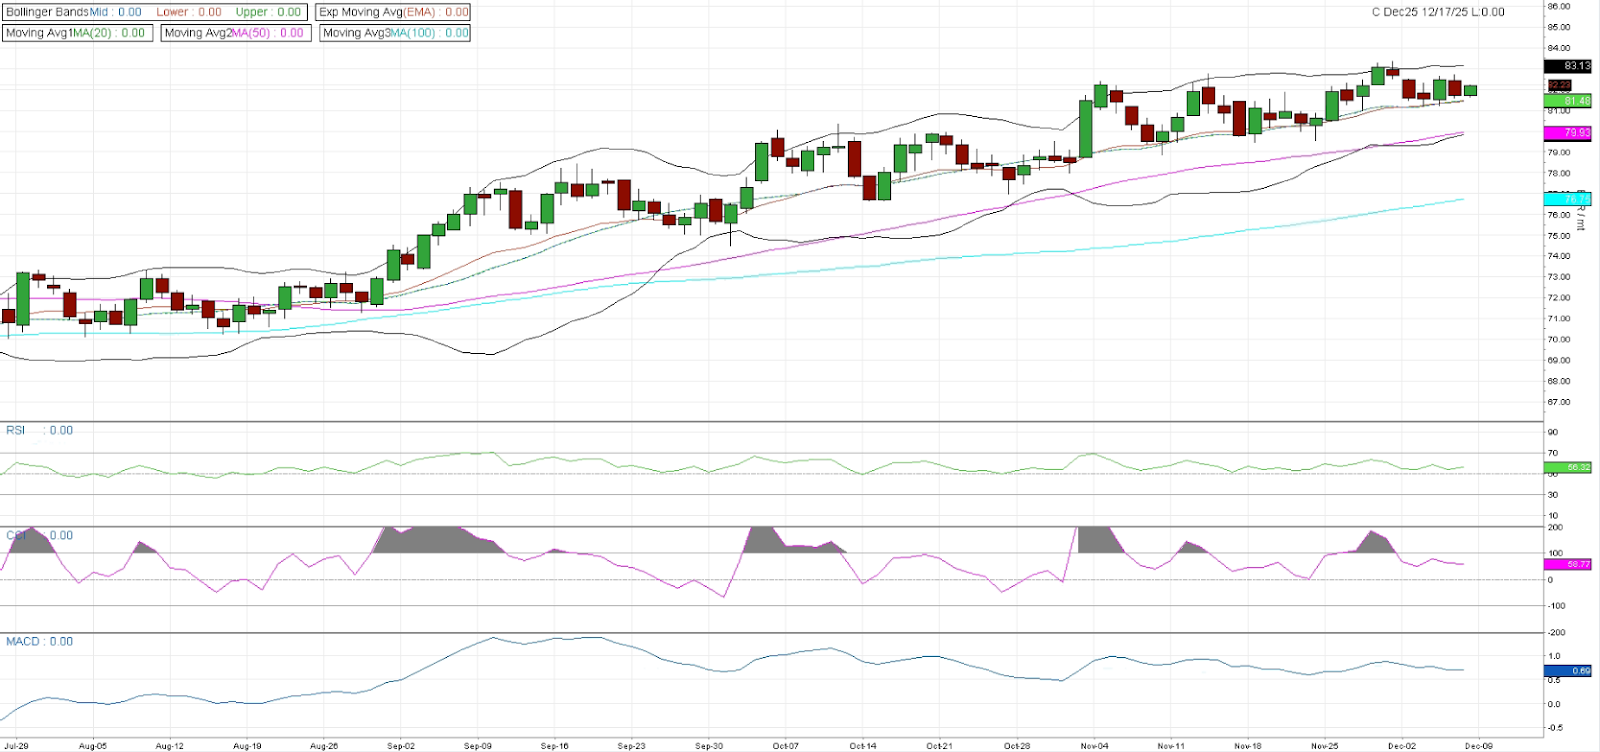
Technical Analysis
Price is still hovering near the upper Bollinger Band around 83.1, showing that bulls maintain control. However the band isn't bramaticfally expanding, this would suggest the moomentum is positive, but not explosive. The 20- MA (81.4), 50-MA(79.9) and 100-MA (76.5) are all rising in a clean bullish stack, giving the trend a steady, well-supported structure. Even though price is floating above the 20-MA, it’s moving sideways enough to hint at mild consolidation rather than an aggressive breakout. RSI is sitting around 56., right in neutral - bullish territory with no signs of overextantion, but also no fresh surge in momentum. CCI at around 62.8 reflects moderate strength: above zero, supportive for bulls, but not at the kind of extreme that tends to precede a reversal. MACD is positive but trending flat, showing momentum slowly grinding rather than accelerating, could be considered as a classic sign of trend continuation with a potential for small pullbacks.
Bias indicates a slight bullish signal as long as price holds above the 20-MA and stays in the upper half of the Bollinger channel. But with indicators leveling out, this could easily turn into a sideways consolidation before the next decisive move. No strong breakout signal yet, more of a steady grind with room for both continuation and a small reset.
Chart B: December 2025 EUA Price (EUR) - Technical
AFS ENERGY B.V.
The information contained in the AFS Energy EU ETS Report, hereinafter Report, has been compiled or arrived from sources believed to be reliable but no representation or warranty, express or implied, is made as to their accuracy, completeness, timeliness, correct sequencing or correctness.
AFS Energy B.V. does not accept any liability, contingent otherwise for (i) the accuracy, completeness, timeliness or correctness of any information provided in the Report, (ii) any decision made, or action taken by you in reliance upon any of them and (iii) any direct or consequential loss arising from the use of the Report. AFS Energy B.V. does not make any representation or warranty about the suitability of the information in the Report.
The information contained in the Report is published for the assistance of the recipient but is not to be relied upon as authoritative or taken in substitution for the exercise of judgement by any recipient.

