We collaborate to achieve sustainable success
A leading environmental solution provider
Get in touch with usAFS Energy EU ETS Report Week 41 2025

Do you want to receive to-the-minute up to date info? Please sign up to our client portal and/or to the Viridian Exchange.
Gas storage stands at 82.6% as of October 3rd, keeping supply conditions stable ahead of winter. Yet, renewed Russian attacks on Ukraine’s energy infrastructure and Lithuania’s call to end Russian gas imports reintroduce geopolitical risk, adding speculation to a mild bullish undertone. On the policy side, EU talks on solar expansion and new carbon market mechanisms could possibly ease long-term pressure on industry, while trade tensions and high shipping non-compliance may temper short-term EUA demand.
Outlook: Overall fundamentals retain neutral tendency, leaning slightly bullish as geopolitical risks offset strong storage and improving supply stability.
Auction volume: 12.29 million EUAs,1.37 less than last week
Energy Fundamentals
- Gas storage sits at 82.6% full on October 3rd
- Lithuania calls to end imports of Russian gas
- Russia attacks Ukraine's Naftogaz sites
- ‘Worse than Trump’s tariffs’: EU steel protections are poised to pummel British industry
- New farm carbon market could relieve pressure on EU heavy industry, study finds
- European Commission representatives, EIB and ministers meet to discuss future of solar in Europe
- Lost at sea: Shippers’ EU ETS non-compliance rate triple that of other emitters in 2024
Investment Funds
- Investment funds slightly decreased their net long position to +76.24m EUAs on September 19th (vs. +78.05m EUAs on September 12th).
- Gross short positions decreased to -27.07m EUAs (vs -29.58m EUAs).
- Gross long positions decreased to 103.31m EUAs (vs. 107.62m EUAs).
Market Prices:
- Indicative Dec25 EUA Price: € 79.30
- Indicative Spot EUA Price: € 78.94
- YTD Spot EUA Price: € 71.66
- MTD Spot EUA Price: € 77.27
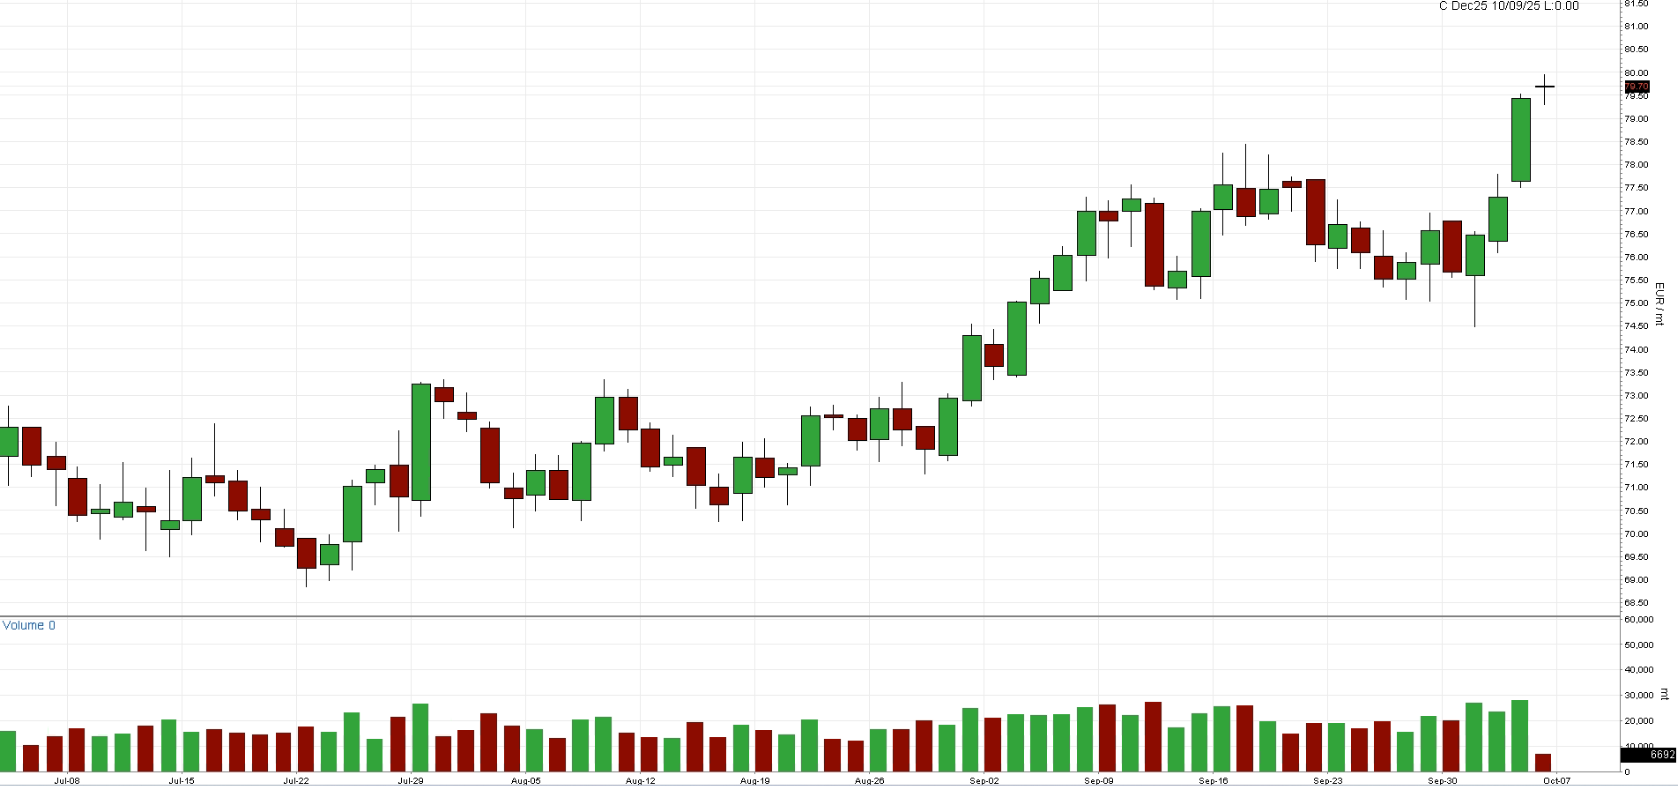
Chart A: December 2025 EUA Price (EUR)
Technical Analysis
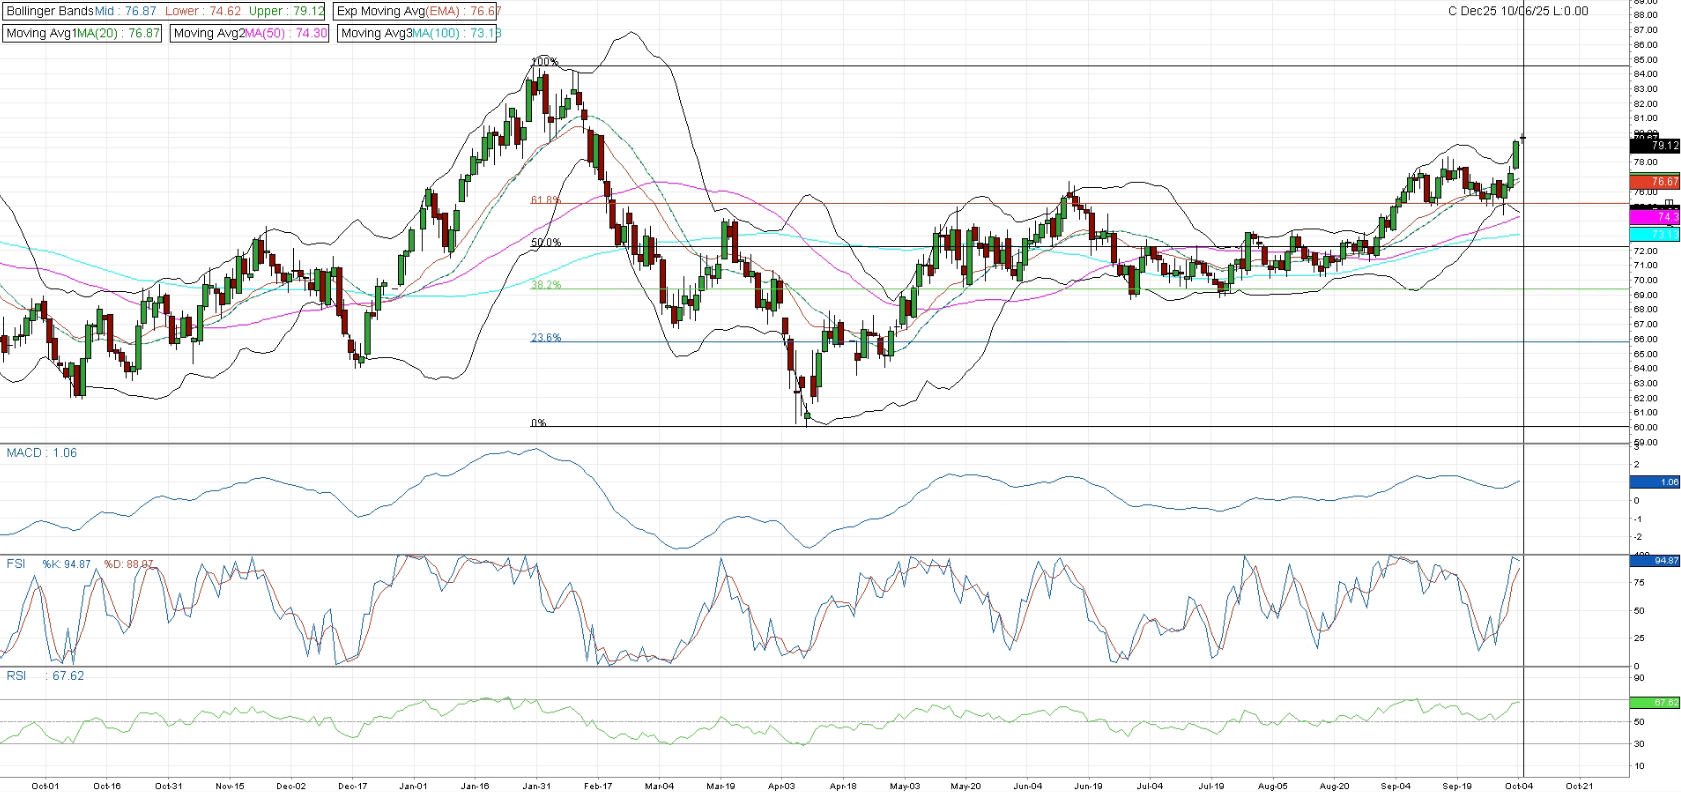
From a technical perspective, EUAs opened today with the widest upward gap since 17 February, reaching a notable high. The price is currently trading above the upper Bollinger Band, though on relatively thin volume. The FSI indicates the potential for a downward correction. Meanwhile, the RSI is approaching 70, suggesting the market may be entering a neutral zone, while the daily MACD remains firmly bullish.
For a sustained bullish confirmation, the price would need to break above the psychological resistance at €80. A successful move beyond this level could open the way toward €84.50, the high recorded on 30 January.
Given the strong opening and supportive volume, an initial move toward the upper Bollinger Band at €79.12 is possible, followed by a retracement toward the mid-Bollinger around €77, before potentially resuming the upward trend.
Chart B: December 2025 EUA Price (EUR) - Technical
AFS ENERGY B.V.
The information contained in the AFS Energy EU ETS Report, hereinafter Report, has been compiled or arrived from sources believed to be reliable but no representation or warranty, express or implied, is made as to their accuracy, completeness, timeliness, correct sequencing or correctness.
AFS Energy B.V. does not accept any liability, contingent otherwise for (i) the accuracy, completeness, timeliness or correctness of any information provided in the Report, (ii) any decision made, or action taken by you in reliance upon any of them and (iii) any direct or consequential loss arising from the use of the Report. AFS Energy B.V. does not make any representation or warranty about the suitability of the information in the Report.
The information contained in the Report is published for the assistance of the recipient but is not to be relied upon as authoritative or taken in substitution for the exercise of judgement by any recipient.

