We collaborate to achieve sustainable success
A leading environmental solution provider
Get in touch with usAFS Energy EU ETS Report Week 38 2025

Do you want to receive to-the-minute up to date info? Please sign up to our client portal and/or to the Viridian Exchange.
With the compliance deadline on September 30th drawing closer, EUA volumes are expected to rise, reinforcing near-term buying interest. While fundamentals such as stable storage and muted power demand may limit immediate upside, the geopolitical backdrop continues to inject risk premium: sanctions threats, tariff disputes, and NATO security tensions all create scope for volatility. Structural support also comes from policy momentum, with the upcoming U.S. – UK nuclear deal underlining the broader energy transition narrative. Overall, while downside appears contained, the balance of risks points to further upward pressure on EUAs into month-end.
Auction volume: 13.66 million EUAs, 2.17 more than last week
Energy Fundamentals
- Gas storage sits at 79.6% full on September 13th
- Trump declares to impose sanctions on Russia in the event that NATO also stops buying their oil
- US and China continue talks today in Madrid on potential 100% tariffs imposed on China in retaliation for purchasing Russian oil
- EU decries Russian drone’s breach of Romanian airspace, after last week’s Russian drone breach of Poland
- Nuclear energy deal between the US and UK to be announced this week during Trump’s visit to the UK
- Compliance period is September 30th, 2025
Investment Funds
- Investment funds increased their net long position to +54.2m EUAs on September 3rd (vs. +20.21m EUAs on August 29th).
- Gross short positions decreased to -32.17m EUAs (vs -36.14m EUAs).
- Gross long positions increased to 86.37m EUAs (vs. 67.89m EUAs).
Market Prices:
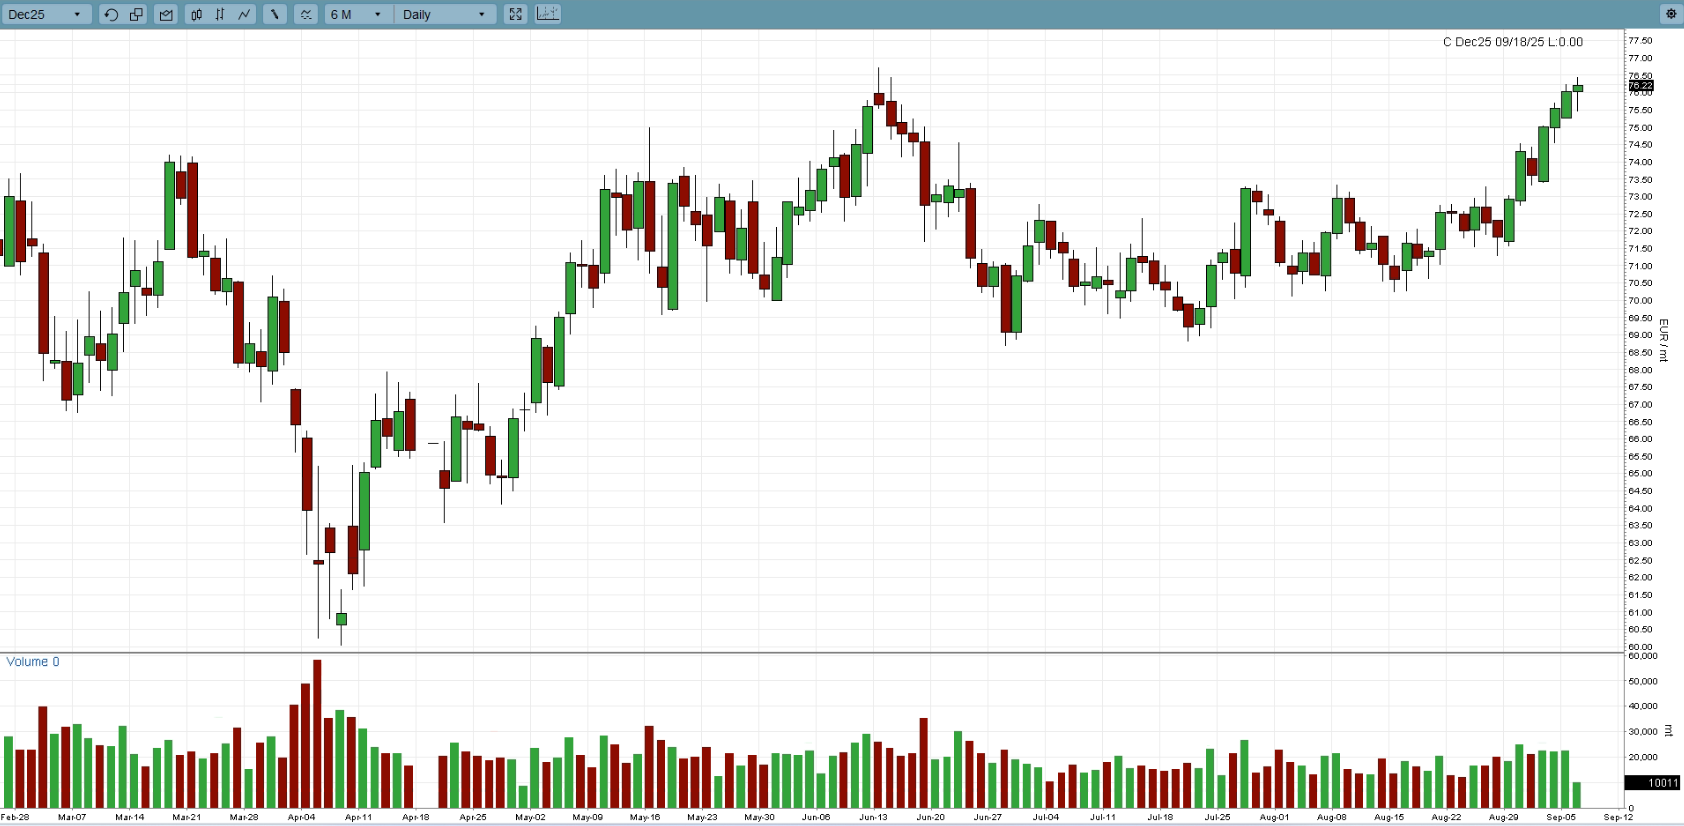
- Indicative Dec25 EUA Price: € 75.56
- Indicative Spot EUA Price: € 75.10
- YTD Spot EUA Price: € 71.261
- MTD Spot EUA Price: € 75.139
Chart A: December 2025 EUA Price (EUR)
Technical Analysis
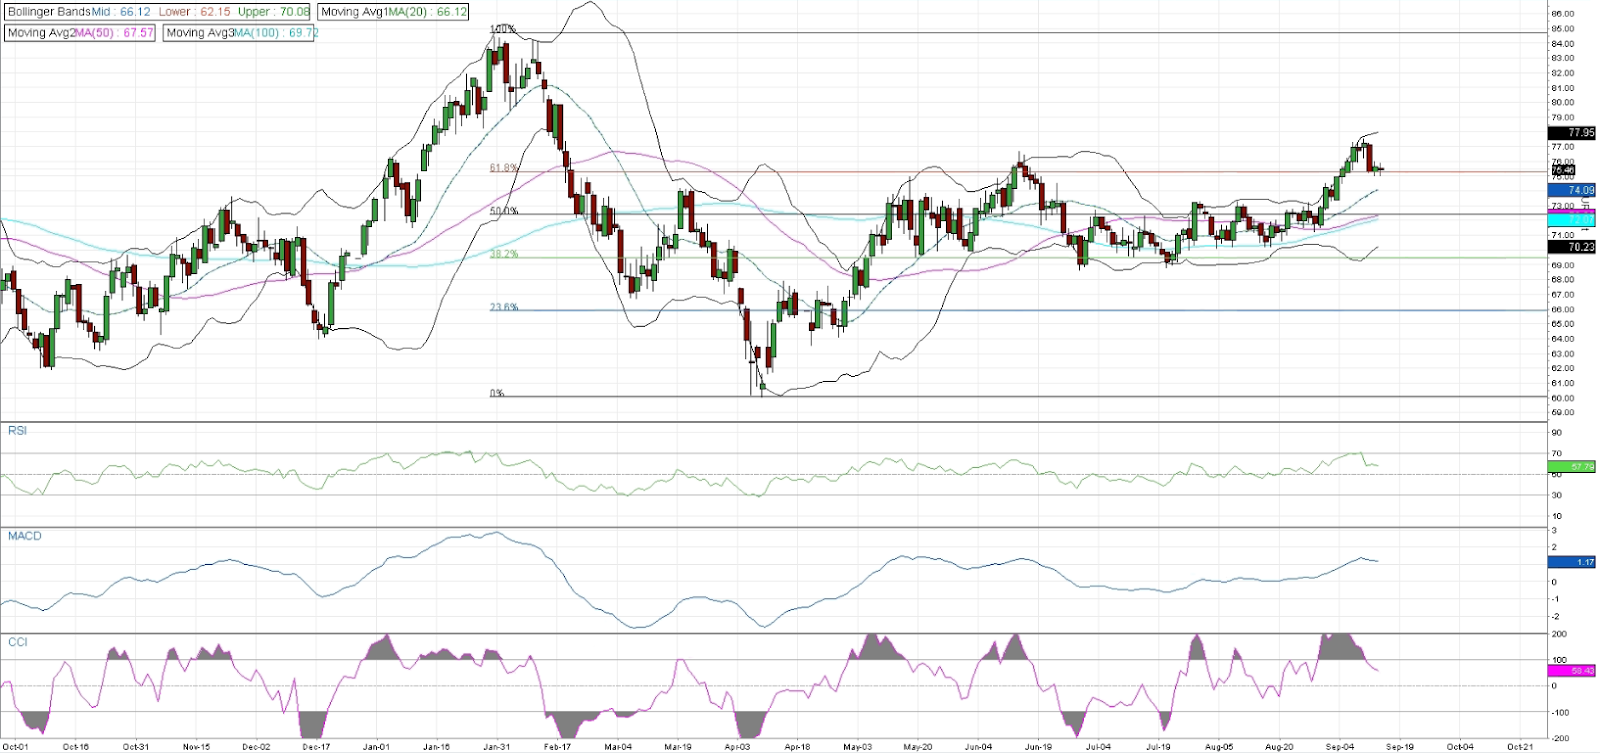
From a technical perspective, EUAs remain in bullish territory, though signs of consolidation are emerging after the sharp rally. The RSI is trending higher at 57.79, leaving room for further gains before entering overbought levels. The MACD at 1.17 continues to signal strong positive momentum, while the CCI at 58.43 reflects a more moderate but still supportive bias.
The December 2025 contract is currently trading around €75.95, close to the upper boundary of the Bollinger Bands. The immediate resistance level lies at €78.50, with a breakout potentially opening the path toward the psychological €80.00 level and beyond.
On the downside, initial support is seen at €74.09 (23.6% Fibonacci retracement), followed by €73.00 (50-day MA). A deeper correction could bring the €71.00–€70.23 zone into focus, where the 100-day MA and the lower Bollinger Band converge. Overall, the technical outlook remains bullish, with momentum indicators still supportive of further upside, although minor pullbacks or sideways consolidation should be expected after the recent strong advance.
Chart B: December 2025 EUA Price (EUR) - Technical
AFS ENERGY B.V.
The information contained in the AFS Energy EU ETS Report, hereinafter Report, has been compiled or arrived from sources believed to be reliable but no representation or warranty, express or implied, is made as to their accuracy, completeness, timeliness, correct sequencing or correctness.
AFS Energy B.V. does not accept any liability, contingent otherwise for (i) the accuracy, completeness, timeliness or correctness of any information provided in the Report, (ii) any decision made, or action taken by you in reliance upon any of them and (iii) any direct or consequential loss arising from the use of the Report. AFS Energy B.V. does not make any representation or warranty about the suitability of the information in the Report.
The information contained in the Report is published for the assistance of the recipient but is not to be relied upon as authoritative or taken in substitution for the exercise of judgement by any recipient.

