We collaborate to achieve sustainable success
A leading environmental solution provider
Get in touch with usAFS Energy EU ETS Report Week 34 2025

Do you want to receive to-the-minute up to date info? Please sign up to our client portal and/or to the Viridian Exchange.
Market tone remains cautiously neutral-to-bearish in the near term, with downside pressure from softening TTF gas prices, oversupply signals in gas markets, and muted power sector support. Oil strength provides some offset, but geopolitical uncertainty and macro event risk keep conviction limited.
Into winter 2025/26, weather dynamics (weak La Niña) and potential shifts in geopolitical alignment could restore upside, underpinning a medium-term bullish bias. For this week, however, directional conviction is limited and range-bound trade is most likely, skewed slightly lower unless headline risk turns supportive.
Auction volume: 13.42 million EUAs, the same as last week
Energy Fundamentals
- Gas storage sits at 73.6% full on August 16th
- TTF gas futures nearing 2024 low pending Zelensky-Trump peace talks
- Oil prices climb after US adviser says India's Russian crude buying has to stop
- Zelenskyy hails US security vow — but rules out sacrificing uncaptured land
- An early look at the Winter 2025/2026 shows the influence of a weak La Niña phase.
- Oil Prices Close Positive, Brent Nears $66 per Barrel
- Roth cuts gas stocks as oversupply threatens natural gas prices into 2026
- Geopolitics dominates, before Fed takes the stage
.Investment Funds
- Investment funds increased their net long position to +28.86m EUAs on August 8th (vs. +20,75m EUAs on August 1st).
- Gross short positions decreased to -37.12m EUAs (vs -38,57m EUAs).
- Gross long positions increased to 65.97m EUAs (vs. 59.31m EUAs).
Market Prices:
- Indicative Dec25 EUA Price: € 70.82
- Indicative Spot EUA Price: € 70.25
- YTD Spot EUA Price: € 71.00
- MTD Spot EUA Price: € 70.89
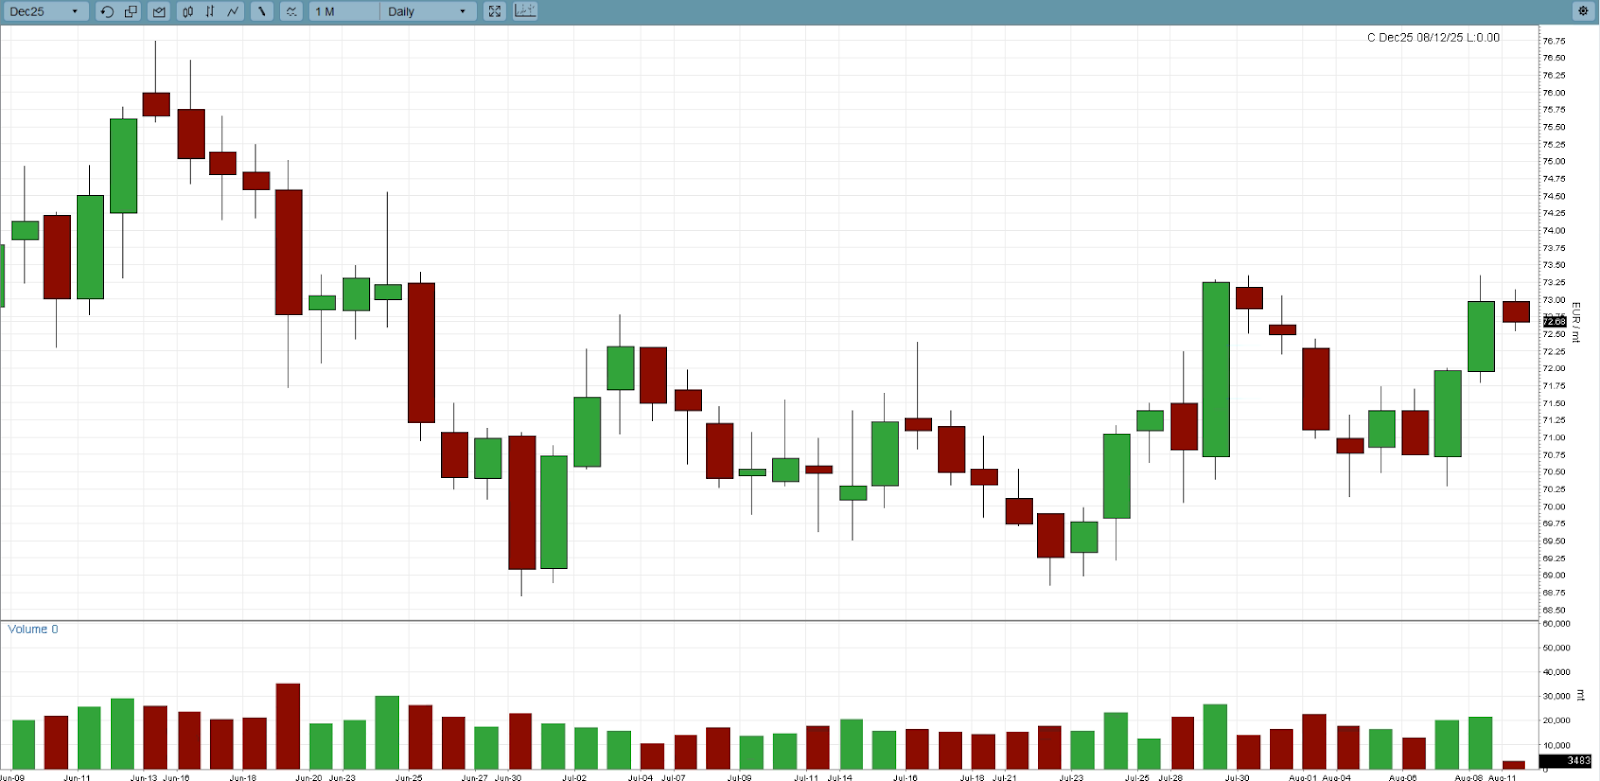
Chart A: December 2025 EUA Price (EUR)
Technical Analysis
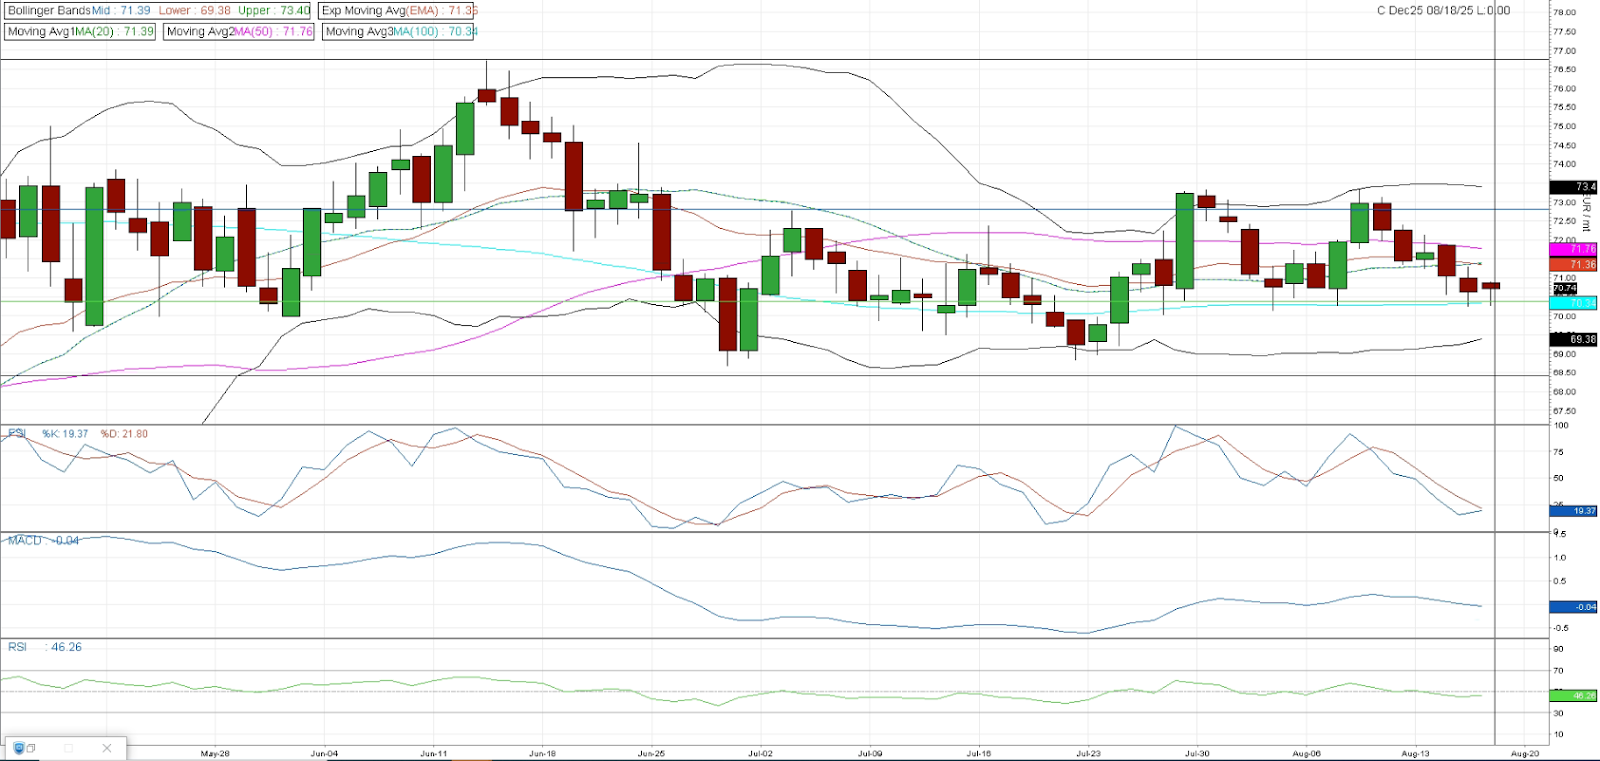
Last week, EUAs traded with a bearish bias, resulting in only minor adjustments to the technical outlook. From an FSI perspective, the market appears to be gradually approaching conditions for a potential recovery, though both MACD and RSI remain in neutral territory. Low trading volumes have also contributed to reduced volatility, suggesting that once liquidity returns, upward momentum could emerge.
On the upside, key resistance levels are observed at €71.36 (EMA), €71.76 (50-day MA), €72.80 (23.6% Fibonacci retracement), and €73.40 (upper Bollinger band).
On the downside, support continues to be tested around €70.30, which coincides with the 50% Fibonacci retracement level and is closely aligned with the 100-day MA. A break below this level could open the door to €69.39, though compliance buying may provide support before such a decline materializes.
Chart B: December 2025 EUA Price (EUR) - Technical
AFS ENERGY B.V.
The information contained in the AFS Energy EU ETS Report, hereinafter Report, has been compiled or arrived from sources believed to be reliable but no representation or warranty, express or implied, is made as to their accuracy, completeness, timeliness, correct sequencing or correctness.
AFS Energy B.V. does not accept any liability, contingent otherwise for (i) the accuracy, completeness, timeliness or correctness of any information provided in the Report, (ii) any decision made, or action taken by you in reliance upon any of them and (iii) any direct or consequential loss arising from the use of the Report. AFS Energy B.V. does not make any representation or warranty about the suitability of the information in the Report.
The information contained in the Report is published for the assistance of the recipient but is not to be relied upon as authoritative or taken in substitution for the exercise of judgement by any recipient.

