We collaborate to achieve sustainable success
A leading environmental solution provider
Get in touch with usAFS Energy EU ETS Report Week 28 2025

Do you want to receive to-the-minute up to date info? Please sign up to our client portal and/or to the Viridian Exchange.
Previous Week Events:
Last week, Dec25 EUA prices closed 0.5% lower on Friday, posting a total gain of 1%. Trading volumes were very low, as the market started experiencing ‘summer softness’.
Looking ahead, U.S. tariffs on the EU remain in focus, with the original July 9 deadline potentially extended to August 1. Beyond Europe, Trump is reportedly considering raising tariffs on BRICS nations, adding further uncertainty to the global trade landscape. The Russia-Ukraine war shows no sign of de-escalation, with Trump attempting to intervene through direct communication with both parties. In the EU, efforts to reduce reliance on Russian gas continue, supported by a rise in solar power generation. However, Trump’s proposed “Big Beautiful Bill” targets renewable energy policies, favouring increased fossil fuel use. Given the market uncertainty surrounding tariffs, low volumes and ongoing developments in the Russia-Ukraine conflict, EUA prices might experience significant volatility over the coming week.
Auction volume: 13.4 million EUAs, 2.1 million more than last week
Energy Fundamentals
- Gas storage sits at 60.3% full on July 5th.
- US Commerce secretary Scott Bessent suggests unilateral tariffs could be delayed until the 1st of August.
- Trump threatens an extra 10% tariff on all BRICS countries, calling their policies ‘Anti-American’.
- Trump spoke to Putin over the weekend, but stated that no progress was made on the war in Ukraine.
- Trump also spoke to Zelensky, in what the latter called the most productive discussion yet.
- Ukraine scales up its drone production capacity as Russia launches its largest attacks on Ukraine so far.
- A report covering the period January to March 2025 shows the EU recorded record solar power production and significant progress away from Russian gas.
- Trump’s budget bill hits renewable energy, boosts fossil fuels.
- Oil prices dip as OPEC+ increases supply.
Investment Funds
- Investment funds reduced their net long position to +15.58m EUAs on June 27th (vs. +23.02m EUAs on June 20th).
- Gross short positions slightly decreased to -35.11m EUAs (vs -37.26m EUAs).
- Gross long positions decreased to 50.70m EUAs (vs. 60.28m EUAs).
Market Prices:
- Indicative Dec25 EUA Price: €71.12
- Indicative Spot EUA Price: €70.35
- YTD Spot EUA Price: €71.130
- June Average Spot EUA Price: €72.123
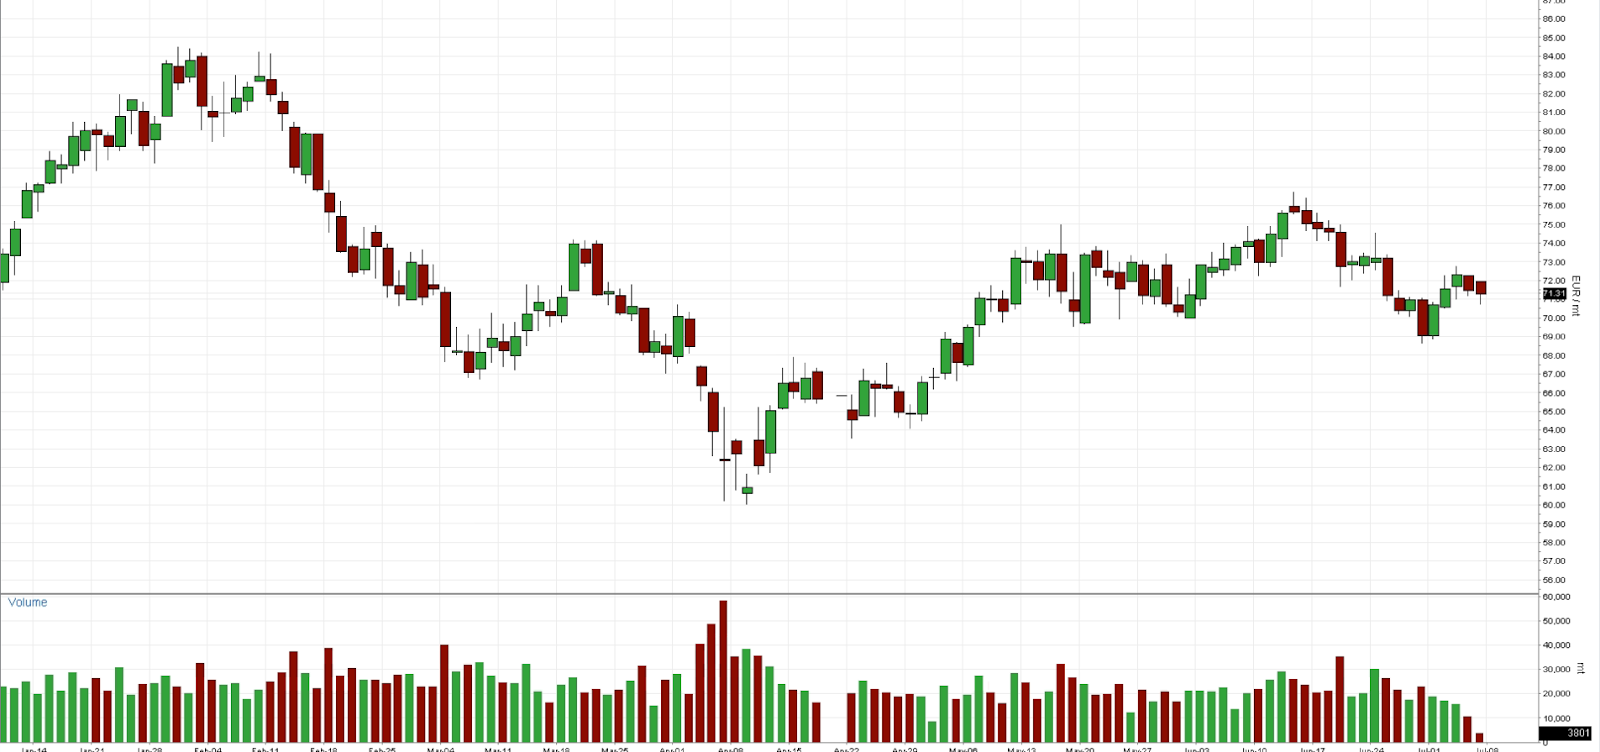
Chart A: December 2025 EUA Price (EUR)
Technical Analysis
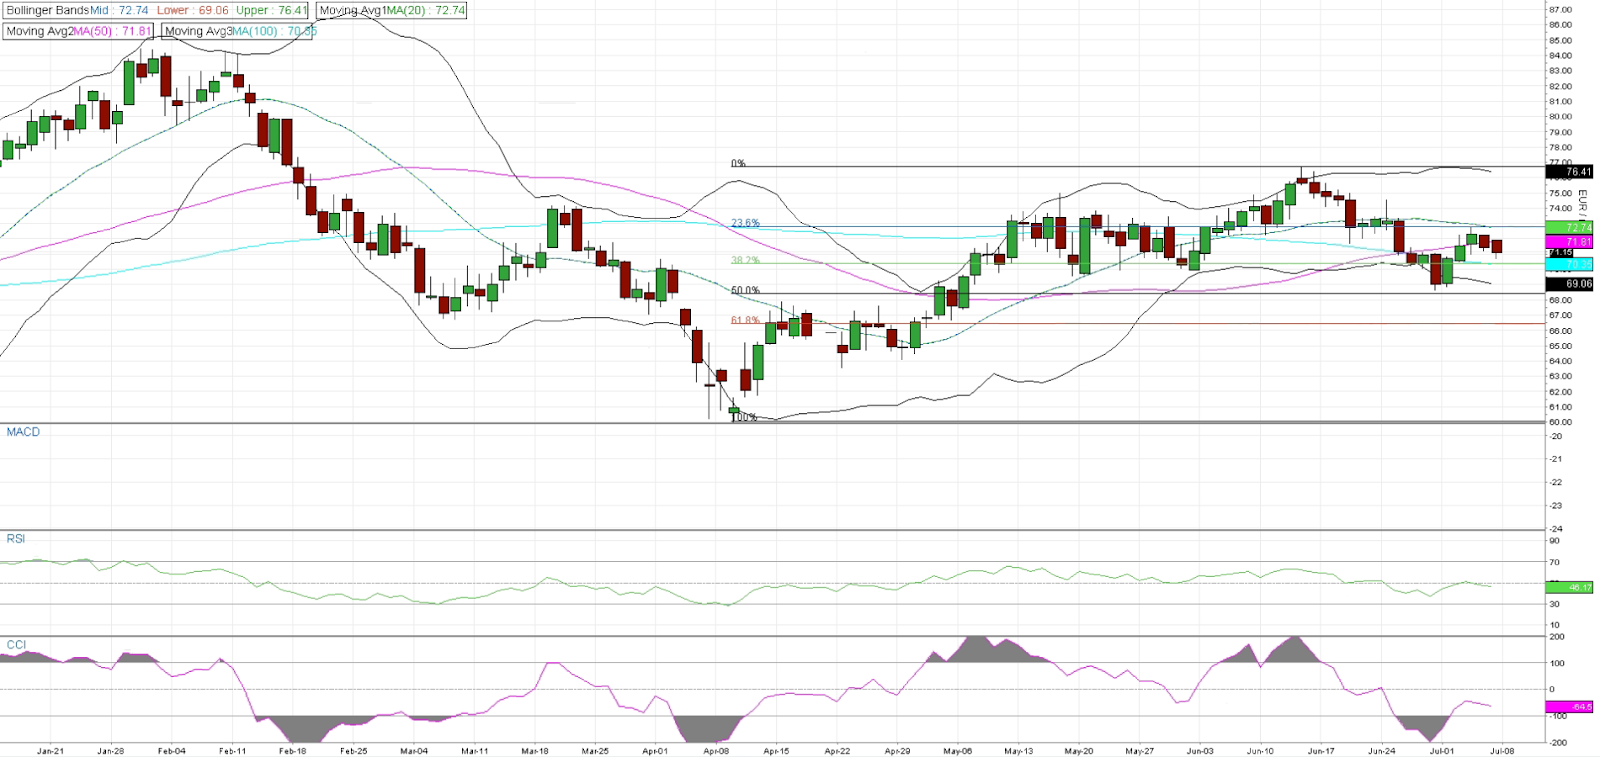
From a technical perspective, Dec 25 EUA prices are currently trading between their Fibonacci 38.2% level at €70.35 and their Fibonacci 23.6% level at €72.79. They are trading above their MA100 at €70.35 but below their MA50 at €71.81 and MA20 at €72.74. Prices are also just below the middle of the Bollinger Bands at €72.74. With the MACD and RSI trending downward from overbought levels, a continued downward movement is possible, with the Fibonacci 38.2% level at €70.35—coinciding with the MA100—acting as strong resistance, followed by the €70 psychological level. However, the CCI is moving upward from oversold territory, offering a mixed signal. Should the price reverse upward, the next resistance levels to watch are the mid Bollinger Bands, the MA20 at €72.74, and the Fibonacci 23.6% level at €72.79.
Chart B: December 2025 EUA Price (EUR) - Technical
AFS ENERGY B.V.
The information contained in the AFS Energy EU ETS Report, hereinafter Report, has been compiled or arrived from sources believed to be reliable but no representation or warranty, express or implied, is made as to their accuracy, completeness, timeliness, correct sequencing or correctness.
AFS Energy B.V. does not accept any liability, contingent otherwise for (i) the accuracy, completeness, timeliness or correctness of any information provided in the Report, (ii) any decision made, or action taken by you in reliance upon any of them and (iii) any direct or consequential loss arising from the use of the Report. AFS Energy B.V. does not make any representation or warranty about the suitability of the information in the Report.
The information contained in the Report is published for the assistance of the recipient but is not to be relied upon as authoritative or taken in substitution for the exercise of judgement by any recipient.

