We collaborate to achieve sustainable success
A leading environmental solution provider
Get in touch with usAFS Energy EU ETS Report Week 27 2025

Do you want to receive to-the-minute up to date info? Please sign up to our client portal and/or to the Viridian Exchange.
Previous Week Events:
On Friday, the Dec 25 EUA prices settled 0.8% higher, but ultimately registered a weekly decline of 2.8%. Correlation with Dutch TTF was again broken, which continued to drop through Friday.
For the week ahead, there is a possibility that the focus moves towards progress on trade deals with the US, as the 9th of July deadline is rapidly approaching. Furthermore, with heatwaves expected around Europe, energy consumption is expected to be high as demand for AC ramps up, which could potentially strengthen market momentum for the week. On the other hand, we are seeing a drop across the board in energy markets, as risk premium is fading as tensions have eased in the middle east. Taking these reasons into account, there is a possible scenario that the market trades in a sideways to bullish range for this week
Auction volume: 11.3 million EUAs, 2.1 million less than last week
Energy Fundamentals
- Gas storage sits at 58.5% full on June 29th.
- The EU seeks to reach a trade deal with the US, Mertz and Macron are calling for urgency.
- The EU suggests that a 10% baseline tariff with the US would trigger retaliation.
- Russia continues to attack Ukraine in one of the largest strikes since the beginning of the war three years ago.
- European Gas posts largest weekly drop in two years as supply risk eases.
- Oil prices have dropped as risk premium recedes following easing tensions in the Middle East.
- Greece is battling with wildfires as heatwave expands.
- Summer heat waves are in full swing, which is likely to stress the European power grid this week.
Investment Funds
- Investment funds reduced their net long position to +23.02m EUAs on June 20th (vs. +28.07m EUAs on June 13th).
- Gross short positions slightly decreased to -37.26m EUAs (vs -38.59m EUAs).
- Gross long positions decreased to 60.28m EUAs (vs.66.66m EUAs).
Market Prices:
- Indicative Dec25 EUA Price: €70.30
- Indicative Spot EUA Price: €69.49
- YTD Spot EUA Price: €71.17
- MTD Spot EUA Price: €72.32
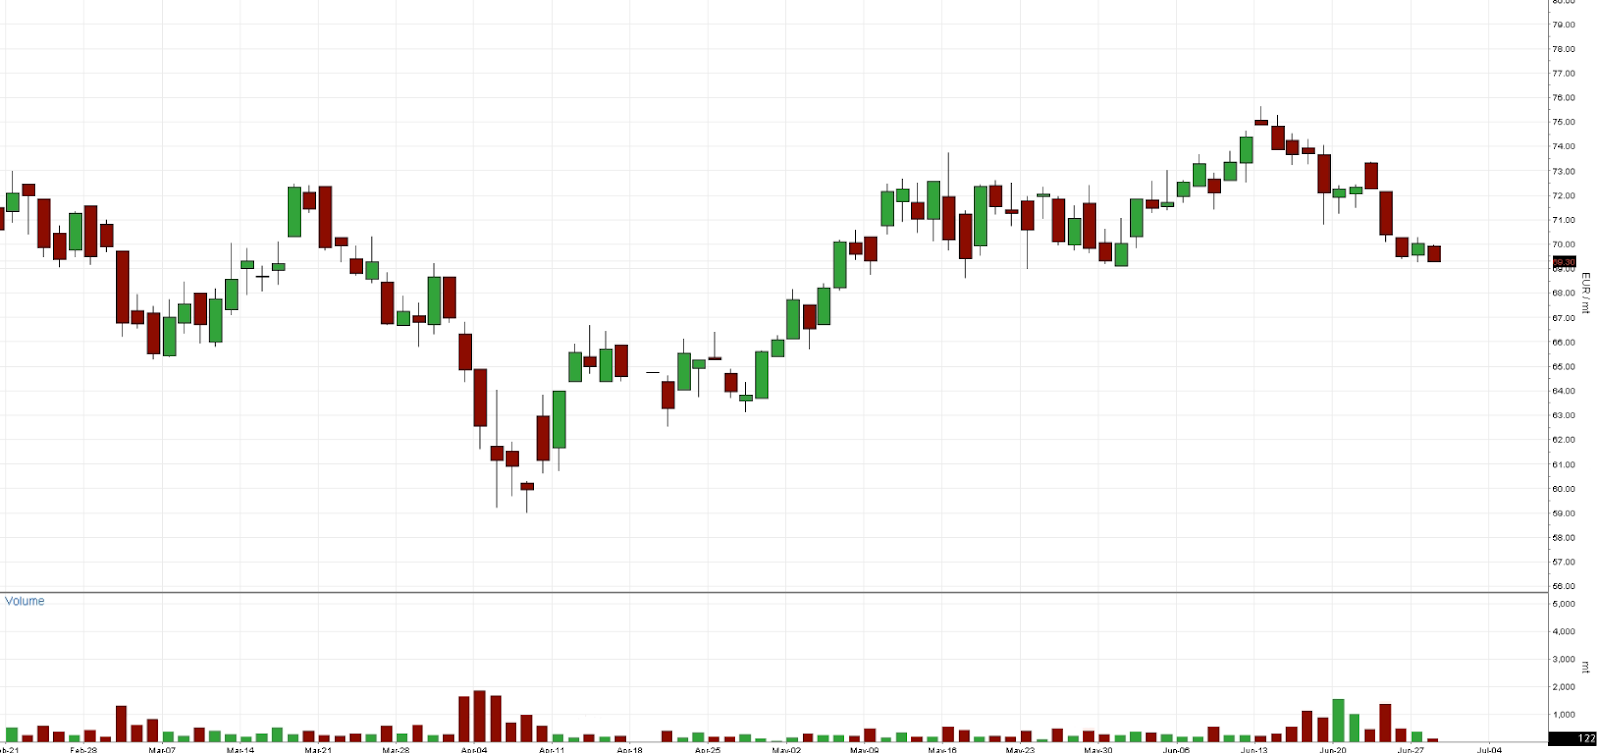
Chart A: December 2025 EUA Price (EUR)
Technical Analysis
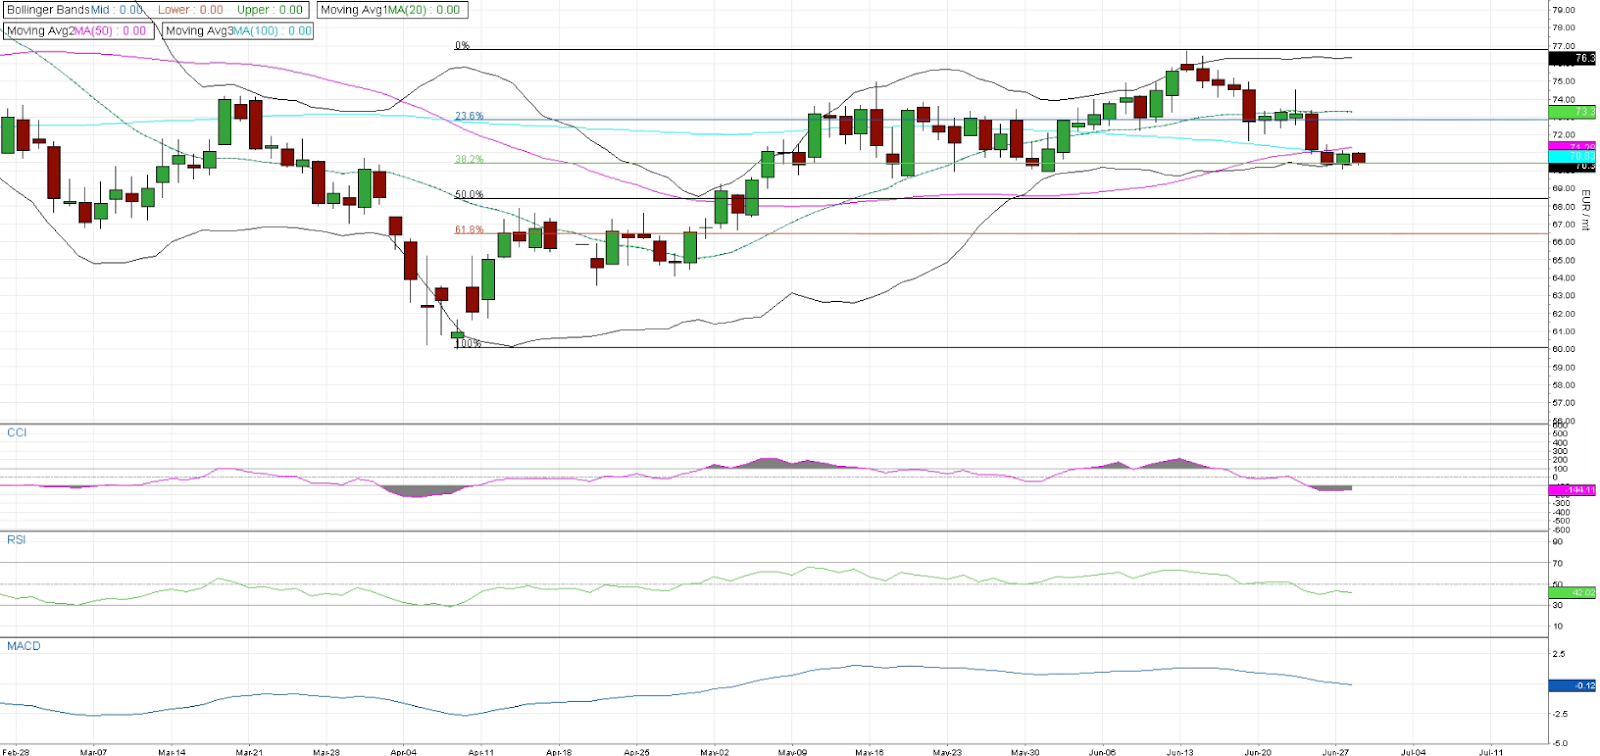
From a technical perspective, the Dec25 EUA price is currently trading just above its Fibonacci 38.2% level at €70.42. It is trading below its MA 20 at €70.30, MA 50 at €71.28 and MA 100 at €70.88, and it is trading around the lower level of the Bollinger Bands at €70.30. The MACD seems to still be descending from overbought levels, which possibly signals potential for a further decrease. However, the CCI and RSI are both at overbought levels, suggesting that the price could start rising. Due to the mixed technical signals, the price for now looks sideways until a decision is made for a future direction. If the price decreases further, an important level to watch is the 50% Fibonacci level at €69.45. In case the price moves towards the upside, the moving averages will act as resistances, alongside the 23.6% Fibonacci level at €72.86.
Chart B: December 2025 EUA Price (EUR) - Technical
AFS ENERGY B.V.
The information contained in the AFS Energy EU ETS Report, hereinafter Report, has been compiled or arrived from sources believed to be reliable but no representation or warranty, express or implied, is made as to their accuracy, completeness, timeliness, correct sequencing or correctness.
AFS Energy B.V. does not accept any liability, contingent otherwise for (i) the accuracy, completeness, timeliness or correctness of any information provided in the Report, (ii) any decision made, or action taken by you in reliance upon any of them and (iii) any direct or consequential loss arising from the use of the Report. AFS Energy B.V. does not make any representation or warranty about the suitability of the information in the Report.
The information contained in the Report is published for the assistance of the recipient but is not to be relied upon as authoritative or taken in substitution for the exercise of judgement by any recipient.

