We collaborate to achieve sustainable success
A leading environmental solution provider
Get in touch with usAFS Energy EU ETS Market Report - Week 9 2026

Do you want to receive to-the-minute up to date info? Please sign up to our client portal and/or to the Viridian Exchange.
Geopolitical and trade developments shaped near-term sentiment for EUAs this week as policymakers navigated rising global tensions. The EU is set to discuss Russian sanctions, while the US plans to raise global tariffs to 15 percent, prompting Europe to pause progress on its working trade deal with Washington. At the same time, pressure from the US on the International Energy Agency to abandon its net-zero 2050 targets has added uncertainty to global climate coordination. In energy markets, February LNG imports into Europe increased, and US natural gas prices jumped amid a powerful blizzard and stronger export flows, contributing to renewed volatility in European gas pricing and influencing short-term power-sector emissions.
Within the EU ETS, regulatory and sectoral issues remained in focus. The Malta Maritime Forum argued that the ETS places disproportionate pressure on island economies, while BIMCO considered adopting a biofuel clause for time charters, highlighting the shipping sector’s gradual adjustment to carbon costs. The Council backed Market Stability Reserve measures to support a smoother launch of ETS2, reinforcing supply-management credibility. Greece’s ambition to become a central gas hub in post-Russia Europe and Repsol’s plans to expand Venezuelan oil output after securing a US permit reflect continued realignment in global energy flows. Overall, trade friction and gas market volatility are driving short-term EUA uncertainty, while regulatory adjustments and sectoral adaptation continue to underpin the longer-term integrity of the ETS.
Auction volume: 9.23 million EUAs, 1.53 million less than last week.
Energy Fundamentals
- Gas storage currently sits at 30.9% (February 21st, 2026)
- EU to discuss Russian sanctions today
- US plans to raise global tariffs to 15 percent
- Europe's working trade deal with the US on pause in response to global tariff hike
- US pushes IEA to drop net-zero by 2050 goals or lose US as a member
- Malta Maritime Forum reflects that ETS is unjust to islands
- BIMCO to Consider Adoption of Biofuel Clause for Time Charters
- Market stability reserve: Council backs measures for a smoother launch of ETS2
- February LNG imports increasing in Europe
- Markets US Natural Gas Jumps on Powerful Blizzard and Higher LNG Exports
- Greece eyes central role in Europe’s post-Russia gas market
- Repsol aims to triple Venezuelan oil output after securing US permit
Investment Funds
- Investment funds decreased their net long position to +82.41m EUAs on February 13th (vs. +94m EUAs on February 6th).
- Gross short positions increased to -26.51m EUAs (vs -24.3m EUAs).
- Gross long positions decreased to 108.92m EUAs (vs. 118.3m EUAs).
Market Prices:
- Indicative Dec26 EUA Price: € 72.74
- Indicative Spot EUA Price: € 71.36
- YTD Spot EUA Price: € 81.665
- MTD Spot EUA Price: € 74.746
Chart A: December 2026 EUA Price (EUR)
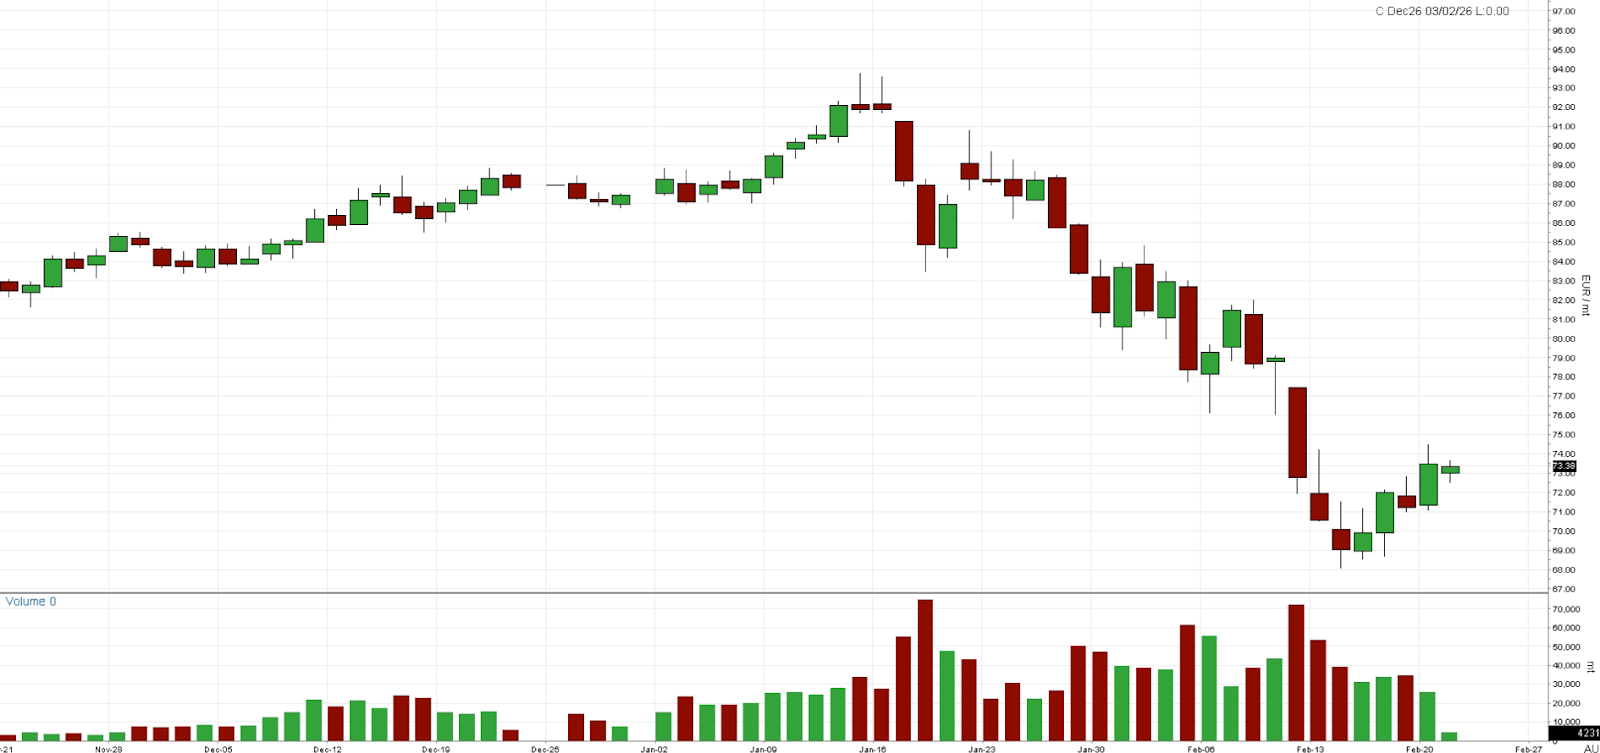
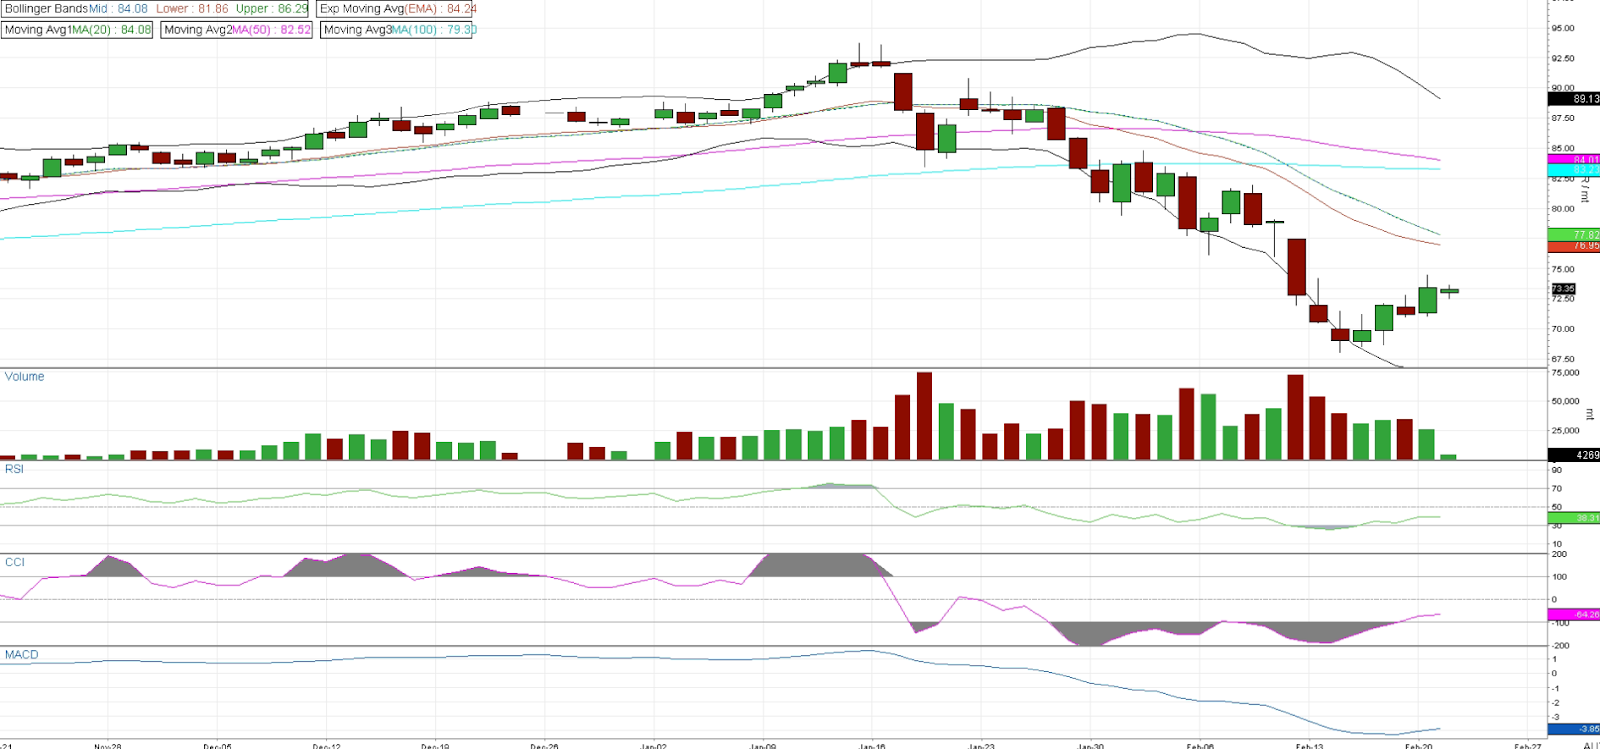
Technical Analysis
Price remains in a broader downtrend after topping near the 100% Fibonacci level, with a clear sequence of lower highs and lower lows. The recent rebound from the €69–70 area appears to indicate correction rather than an impulsive movement. As result, forming a short-term rising channel within a larger bearish structure. For now however, the recovery reflects stabilization, without established confirmation of reversal. The Bollinger Bands expanded aggressively during the sell-off, signaling strong downside momentum. Price repeatedly tagged the lower band before reverting toward the mid-band near €77. Volatility is beginning to compress slightly, but as long as price remains below the mid-band, the technical bias stays tilted to the downside. Moving averages reinforce this view. The 20-day MA is sloping downward, while the 50-day and 100-day MAs sit above price, creating a bearish alignment. Notably, the 50% Fibonacci level around €81 and the 61.8% near €84 align with this moving average cluster, forming a significant resistance zone. The rebound has so far struggled to decisively reclaim these retracement levels, retaining the suggestion of a vulnerable structure.
Momentum is stabilizing but not yet bullish. RSI has recovered from oversold conditions but remains below 50, signaling a weak momentum regime. MACD is still negative, though downside momentum is beginning to decelerate. The €75–78 region represents the key decision zone. Rejection there would likely reinforce the broader bearish structure and reopen pressure toward €70. A sustained break above that cluster, however, would materially improve the technical outlook and increase the probability of a broader recovery phase.
Chart B: December 2026 EUA Price (EUR) - Technical
AFS ENERGY B.V.
The information contained in the AFS Energy EU ETS Report, hereinafter Report, has been compiled or arrived from sources believed to be reliable but no representation or warranty, express or implied, is made as to their accuracy, completeness, timeliness, correct sequencing or correctness.
AFS Energy B.V. does not accept any liability, contingent otherwise for (i) the accuracy, completeness, timeliness or correctness of any information provided in the Report, (ii) any decision made, or action taken by you in reliance upon any of them and (iii) any direct or consequential loss arising from the use of the Report. AFS Energy B.V. does not make any representation or warranty about the suitability of the information in the Report.
The information contained in the Report is published for the assistance of the recipient but is not to be relied upon as authoritative or taken in substitution for the exercise of judgement by any recipient.

