We collaborate to achieve sustainable success
A leading environmental solution provider
Get in touch with usAFS Energy EU ETS Market Report - Week 8 2026

Do you want to receive to-the-minute up to date info? Please sign up to our client portal and/or to the Viridian Exchange.
Geopolitical and energy market developments weighed on EUA sentiment this week as tensions around Ukraine and Russia remained elevated. Volodymyr Zelenskyy stated that Vladimir Putin remains focused on prolonging the conflict, while Ukrainian drones struck a key Russian oil and grain export hub, highlighting ongoing supply risks. Ukraine and Iran are set to be discussed in Geneva, adding another layer of diplomatic uncertainty. At the same time, Europe signalled a gradual shift away from US defence reliance, even as Marco Rubio engaged with Slovakia and Hungary on energy and security. In energy markets, the expansion of floating LNG facilities continues to improve supply flexibility, while milder spring weather pushed natural gas prices lower, reducing short-term pressure on power-sector emissions.
Within the EU ETS, policy uncertainty moved to the forefront as rising carbon prices came under political scrutiny shortly before a sharp market pullback. Comments from Germany’s Friedrich Merz suggesting that the ETS may need reform contributed to a sell-off in European carbon prices, reinforcing concerns over potential regulatory intervention. Lower gas prices and easing weather-related demand further weakened near-term EUA support. Overall, softer energy fundamentals and renewed political debate are weighing on short-term confidence, while longer-term decarbonisation goals continue to anchor the structural outlook for the carbon market.
Auction volume: 10.75 million EUAs, 1.53 million more than last week.
Energy Fundamentals
- Gas storage currently sits at 34% (February 14th, 2026)
- The rise of the floating gas factory
- Zelenskyy says Putin only interested in continued war
- Russian oil and grain export hub hit by Ukraine drones
- Ukraine and Iran to be discussed on Tuesday in Geneva
- Europe to move away from US defence
- US’s Rubio connects with Slovakia, Hungary on energy and defence
- ETS rising prices under the spotlight by EU just before market drop
- European carbon prices slide as Germany’s Merz says EU ETS may need revamping
- Natural gas prices drop as weather becomes milder in Europe for spring
Investment Funds
- Investment funds decreased their net long position to +94m EUAs on February 6th (vs. +100.62m EUAs on January 30th).
- Gross short positions increased to -24.30m EUAs (vs -23.76m EUAs).
- Gross long positions decreased to 118.30m EUAs (vs. 124.38m EUAs).
Market Prices:
- Indicative Dec26 EUA Price: € 70.89
- Indicative Spot EUA Price: € 69.51
- YTD Spot EUA Price: € 83.573
- MTD Spot EUA Price: € 77.197
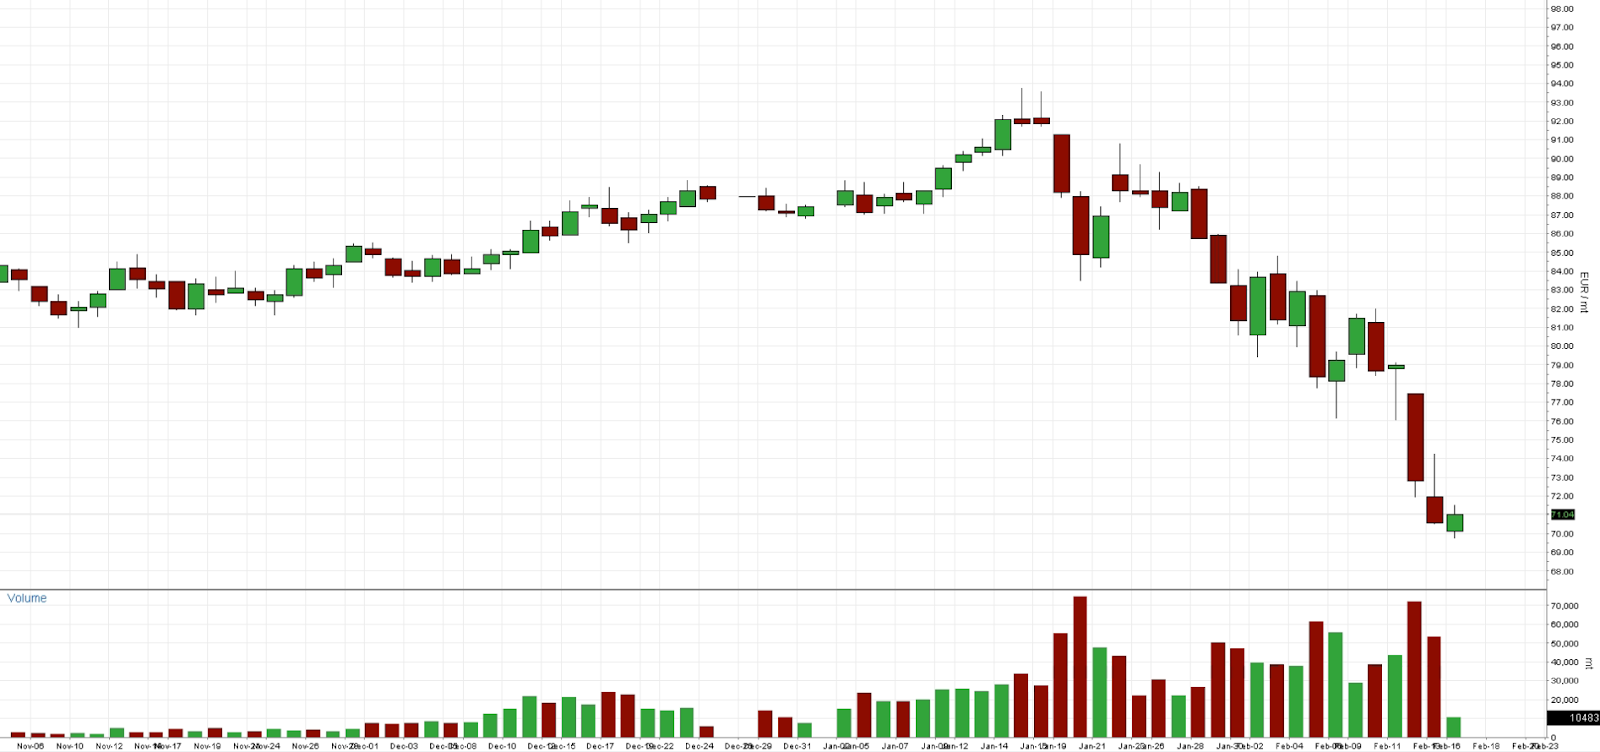
Chart A: December 2026 EUA Price (EUR)
Technical Analysis
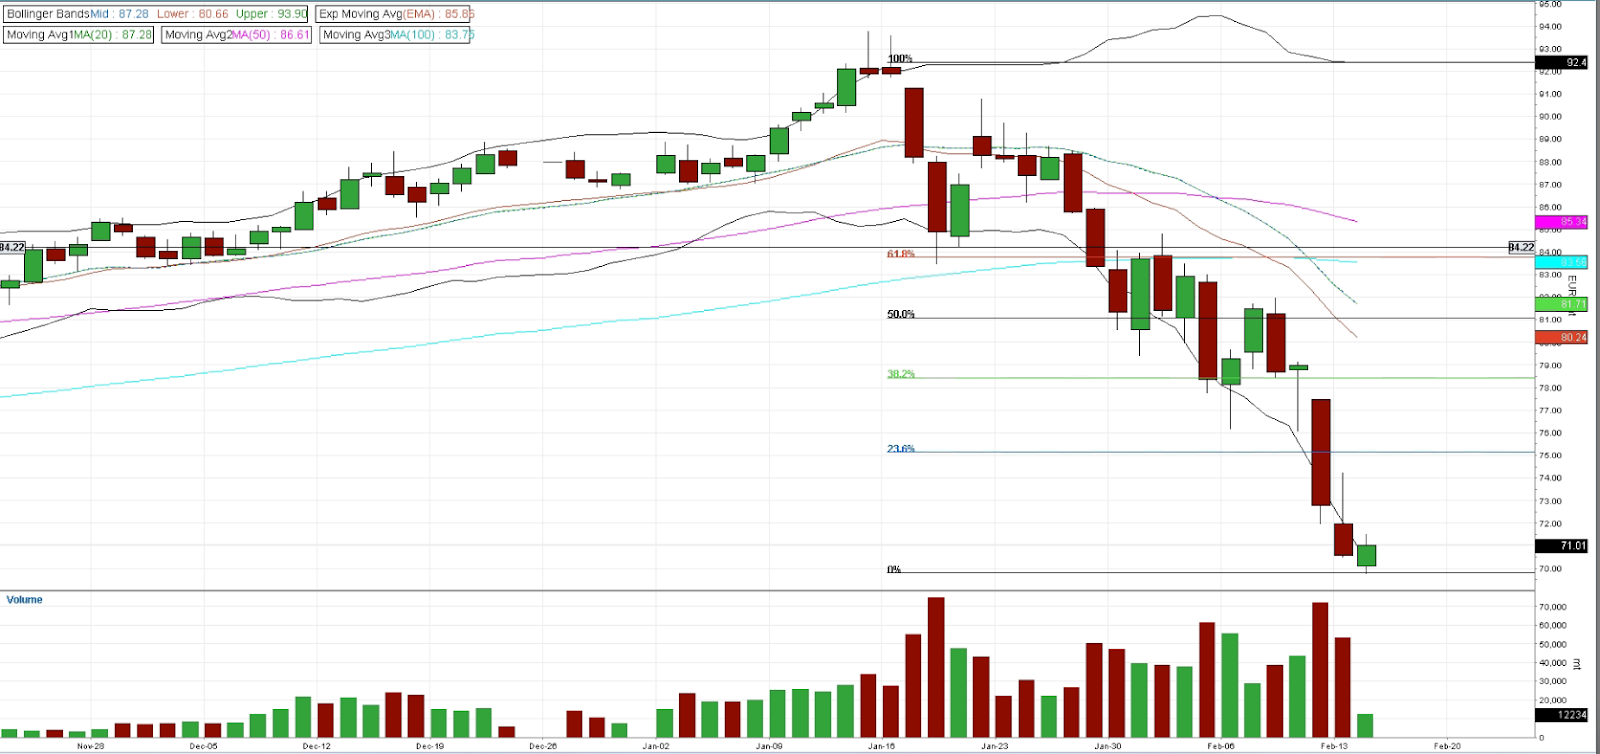
Price action has shifted decisively lower after topping near the 92–93 zone, with the market now trading well below the 20-day MA / EMA (81.71). The 50-day MA (85.34) and 100-day MA (83.56) have also been broken, and short-term averages are beginning to roll over. The Bollinger Bands have expanded to the downside, reflecting accelerating momentum rather than controlled consolidation. Price is hugging the lower band, typically a sign of persistent selling pressure. From a Fibonacci perspective, the retracement of the prior upswing has been deep and decisive. The 61.8% (83.8), 50% (81), 38.2% (78.5), and 23.6% (75) levels were all broken without sustained consolidation, indicating strong directional conviction. Price is now testing the 0% retracement zone near 71, which aligns with the origin of the previous impulse leg and forms a key structural decision area. Momentum indicators support the shift in tone. RSI is likely pressing toward lower territory following the acceleration, reflecting growing downside pressure. CCI has moved firmly into negative territory during the decline, consistent with impulsive selling. MACD has rolled over and remains negative, reinforcing that momentum has transitioned from bullish continuation into indicative bearish territory.
The technical backdrop now leans short-term bearish, with moving averages overhead and Fibonacci supports already breached. However, price is approaching a prior structural base near 70, which could attract stabilization or mean-reversion attempts.
Chart B: December 2026 EUA Price (EUR) - Technical
AFS ENERGY B.V.
The information contained in the AFS Energy EU ETS Report, hereinafter Report, has been compiled or arrived from sources believed to be reliable but no representation or warranty, express or implied, is made as to their accuracy, completeness, timeliness, correct sequencing or correctness.
AFS Energy B.V. does not accept any liability, contingent otherwise for (i) the accuracy, completeness, timeliness or correctness of any information provided in the Report, (ii) any decision made, or action taken by you in reliance upon any of them and (iii) any direct or consequential loss arising from the use of the Report. AFS Energy B.V. does not make any representation or warranty about the suitability of the information in the Report.
The information contained in the Report is published for the assistance of the recipient but is not to be relied upon as authoritative or taken in substitution for the exercise of judgement by any recipient.

