We collaborate to achieve sustainable success
A leading environmental solution provider
Get in touch with usAFS Energy EU ETS Market Report - Week 5 2026

Do you want to receive to-the-minute up to date info? Please sign up to our client portal and/or to the Viridian Exchange.
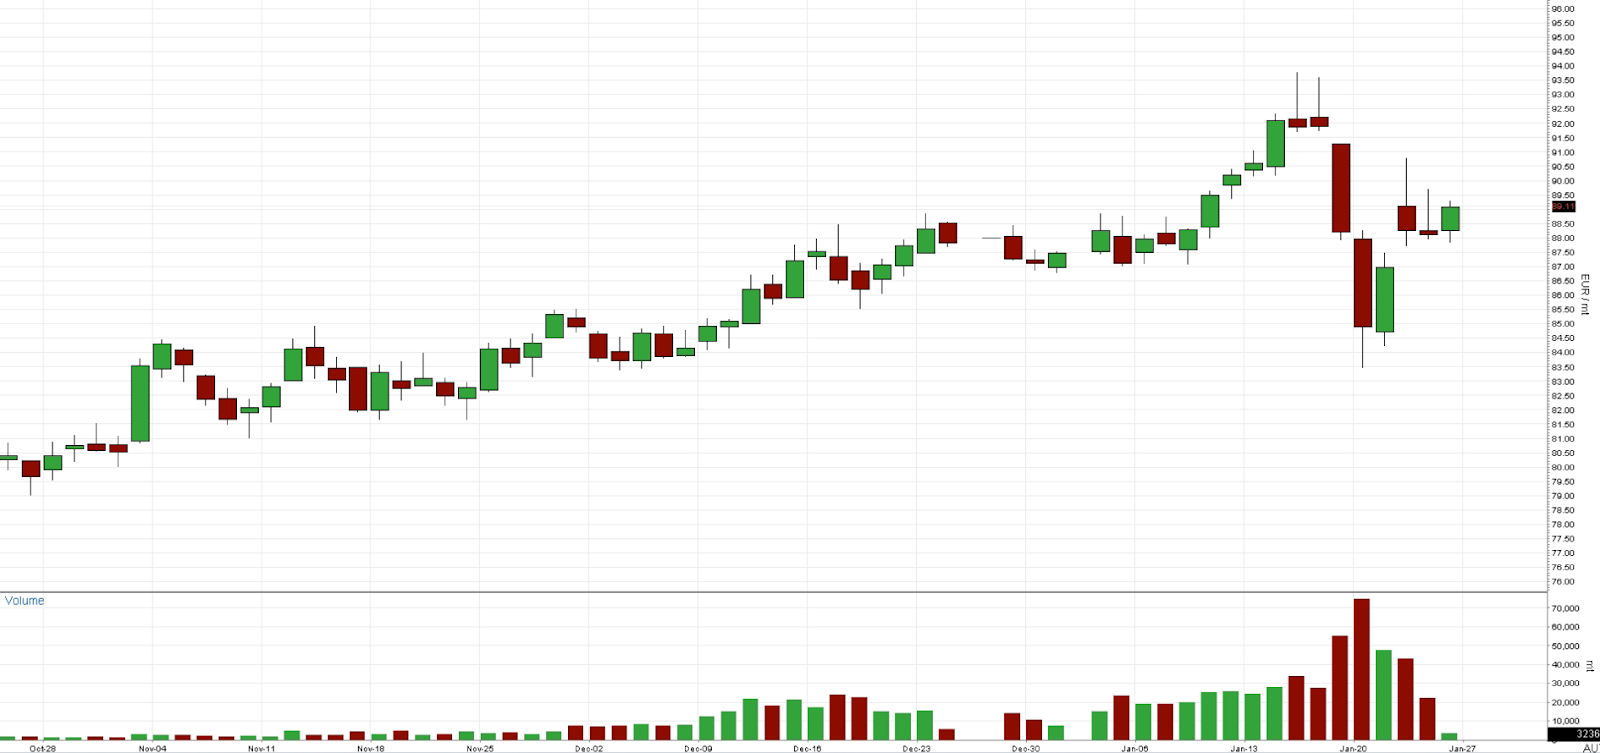
Geopolitical and energy market developments influenced EUA sentiment this week as trade tensions and weather surprises drove volatility. The EU threatened to deploy its so-called “trade bazooka” in response to potential US measures, while Washington signalled possible retaliation, adding uncertainty to transatlantic economic relations. At the same time, India and the EU continued discussions on a free trade agreement, which could eventually influence industrial activity and carbon exposure. Gas prices in both the US and the EU spiked after earlier forecasts of a mild winter proved inaccurate, reviving heating demand expectations and supporting power-sector emissions, a near-term positive for EUA demand.
On the policy and structural side, European powers are set to sign the Hamburg Declaration at a summit on Monday, committing funding to offshore wind development and reinforcing long-term decarbonisation goals. Ukraine, Russia, and the US are expected to continue trilateral peace talks this week, keeping geopolitical risk elevated but with limited immediate impact on carbon markets. Overall, higher gas prices and colder-than-expected weather lend short-term support to EUAs, while accelerating offshore wind investment and ongoing trade negotiations shape the longer-term trajectory of the EU ETS.
Auction volume: 9.23 million EUAs, 1.52 million less than last week.
Energy Fundamentals
- Gas storage currently sits at 45.6% (January 24, 2026)
- EU threatens 'trade bazooka' and US suggests retaliation
- Hamburg Declaration to be signed by European powers at summit Monday, funding offshore wind
- Ukraine, Russia, US trilateral peace talks to continue this week
- India and EU talk free trade deal
- Trump threatens 100% tariffs on Canada
- Gas prices spike in US and the EU after wrongly predicted mild winter
- Russian gas imports: Council gives final greenlight to a stepwise ban
- Natural gas prices hit $6 for first time since 2022 as massive winter storm sweeps U.S.
- Geopolitical tensions drive sharp rises in gas and gold prices
- LNG supply surge to ease gas market pressures in 2026, IEA says
- Colder temperatures expected for February and March across Europe, North America
Investment Fund
- Investment funds increased their net long position to +126.02m EUAs on January 16th (vs. +125.58m EUAs on January 9th).
- Gross short positions decreased to -26.32m EUAs (vs -27.5m EUAs).
- Gross long positions increased to 153.35m EUAs (vs. 153.08m EUAs).
Market Prices:
- Indicative Dec26 EUA Price: €86.57
- Indicative Spot EUA Price: €84.68
- YTD Spot EUA Price: €87.547
- MTD Spot EUA Price: € 87.547
Chart A: December 2026 EUA Price (EUR)
Technical Analysis
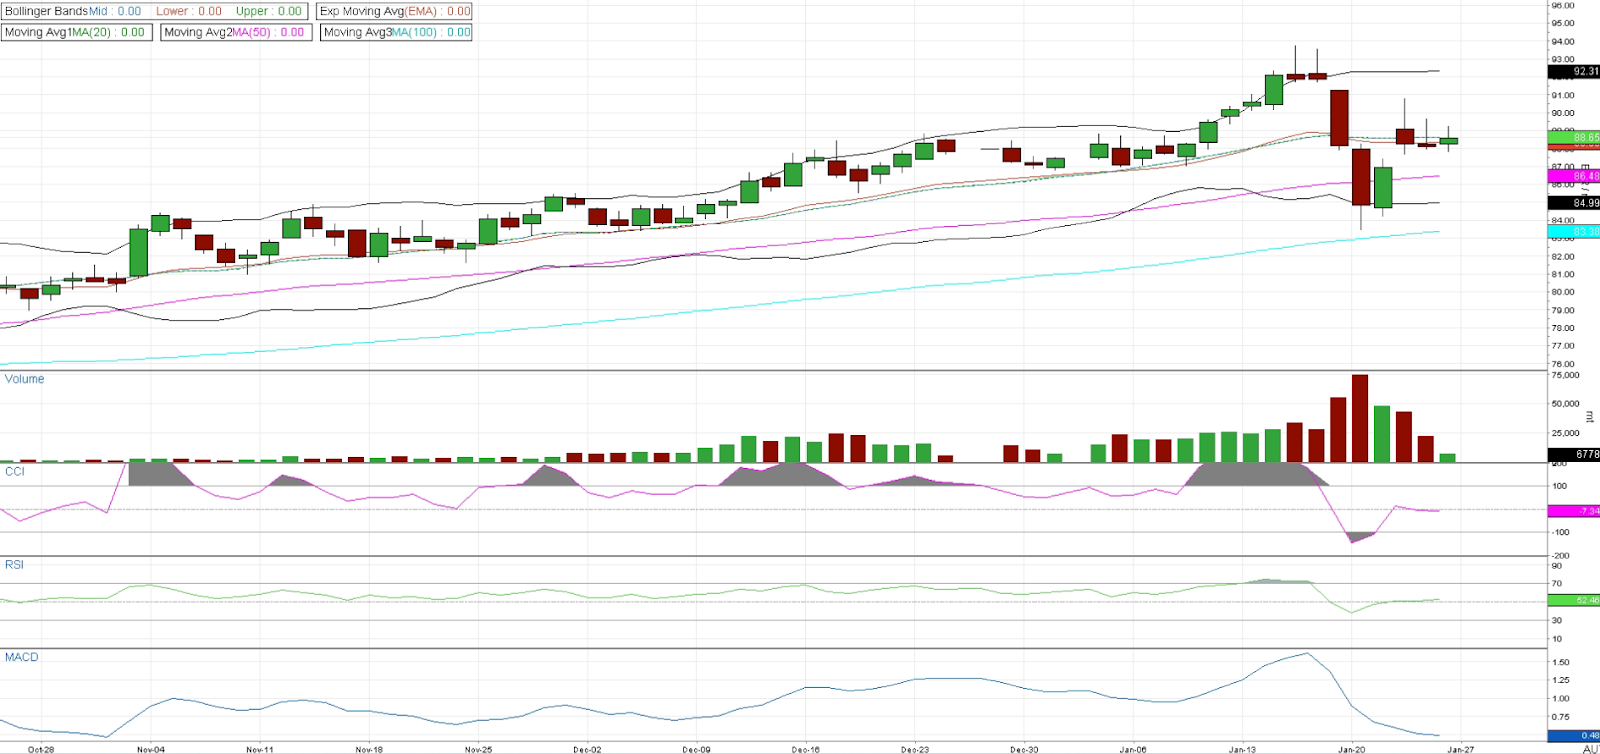
Price action in Dec-26 EUAs has shifted into a corrective phase following the recent push to new highs, with a sharp downside impulse breaking short-term trend support and expanding volatility. Price has moved back inside the Bollinger Bands after rejecting the upper band, signalling momentum-driven liquidation rather than orderly consolidation. The contract has fallen below the MA20 and tested the MA50, marking a clear loss of short-term trend control, although the MA50 continues to slope higher and the MA100 remains well below, keeping the broader trend structure intact.
Momentum indicators reflect this reset. RSI has dropped into the low-40s, indicating a sharp cooling in momentum without reaching oversold conditions, while CCI has swung into negative territory, consistent with a corrective phase. MACD has rolled over but remains above zero, suggesting deceleration rather than outright trend reversal. Overall, the structure has transitioned from trend extension to digestion: stabilisation above the MA50 would preserve the medium-term bullish bias, while recovery back above the MA20 would be needed to re-establish upside momentum.
Chart B: December 2026 EUA Price (EUR) - Technical
AFS ENERGY B.V.
The information contained in the AFS Energy EU ETS Report, hereinafter Report, has been compiled or arrived from sources believed to be reliable but no representation or warranty, express or implied, is made as to their accuracy, completeness, timeliness, correct sequencing or correctness.
AFS Energy B.V. does not accept any liability, contingent otherwise for (i) the accuracy, completeness, timeliness or correctness of any information provided in the Report, (ii) any decision made, or action taken by you in reliance upon any of them and (iii) any direct or consequential loss arising from the use of the Report. AFS Energy B.V. does not make any representation or warranty about the suitability of the information in the Report.
The information contained in the Report is published for the assistance of the recipient but is not to be relied upon as authoritative or taken in substitution for the exercise of judgement by any recipient.

