A leading environmental solution provider
Get in touch with usAuction volume: 14.6 million EUAs, 2.9 million more than last week.
The fundamental backdrop remains supportive for EUAs, with the energy complex again providing the main upside driver. EU gas storage has increased to 68.0% as of September 12, which is seasonally more comfortable, but still leaves the market exposed to renewed supply disruptions heading into winter. The escalation around the Strait of Hormuz is therefore particularly relevant: oil prices have moved above $100/bbl, while the Saudi pipeline outage could threaten up to 4% of global oil supply if repairs are not completed quickly. The postponement of regional talks on securing Hormuz shipping adds further uncertainty around energy flows. For EUAs, the direct oil impact is limited, but persistent disruption to LNG and wider energy logistics can keep European gas and power prices elevated, supporting fossil generation economics and therefore carbon demand. Record heat and drought across Europe also continue to create a “compound risk” for the power system through higher cooling demand and weaker hydropower output, potentially increasing reliance on thermal generation. The policy backdrop is also becoming incrementally more supportive. EU member states have provisionally agreed to retain the MSR invalidation mechanism, which keeps the structural scarcity mechanism intact and limits the risk of surplus allowances returning to the market; the Commission is currently still placing around 190.5 million EUAs into the MSR for the September 2026–August 2027 period. At the same time, proposals to direct a larger share of ETS revenues towards industrial decarbonisation reinforce the longer-term demand for carbon investment, while the EU-India trade agreement confirms that carbon-related costs remain applicable to Indian steel entering the European market. On the other hand, lower Rhine water levels are increasing freight costs and could disrupt industrial and coal logistics, creating a mixed effect depending on the resulting power-generation mix.
Overall, the fundamental bias for Dec-26 remains moderately bullish. The combination of geopolitical energy disruption, elevated oil/gas risk and weather-related pressure on Europe's power system provides a supportive backdrop for EUA demand, while the MSR mechanism reinforces the structural scarcity story. The main counterweights are the gradual improvement in gas storage and the possibility that persistently high energy prices begin to weigh on European industrial demand.
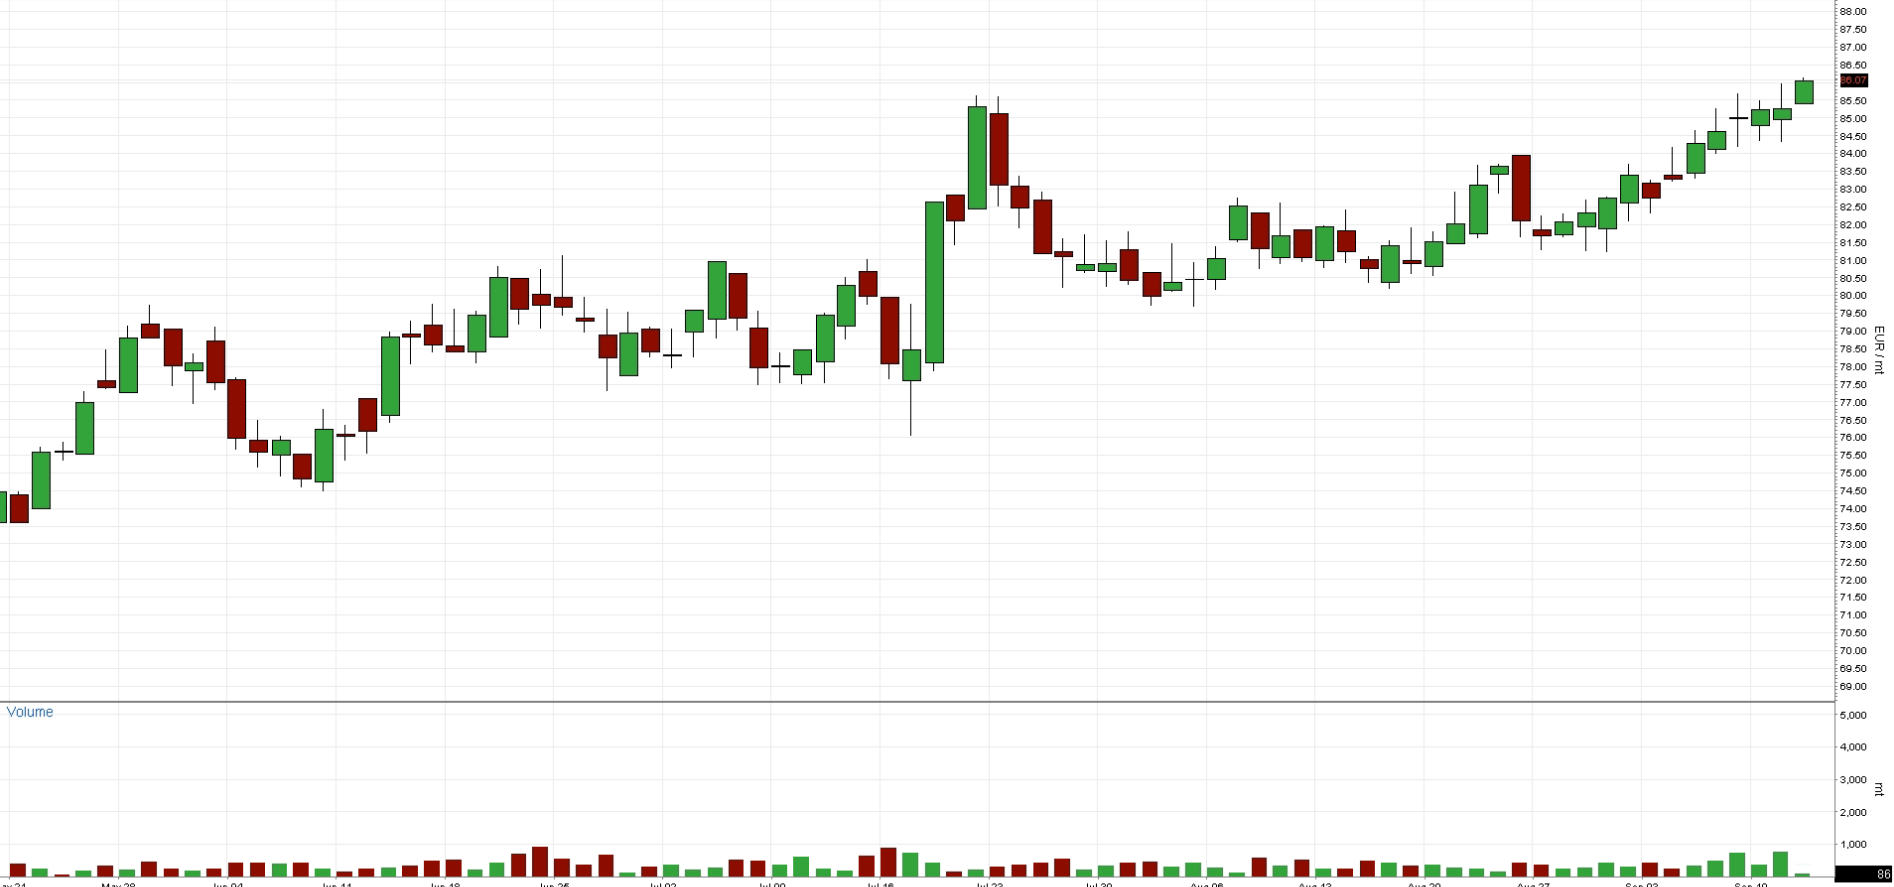
Chart A: EUA Spot (Futures Today) Price (EUR)
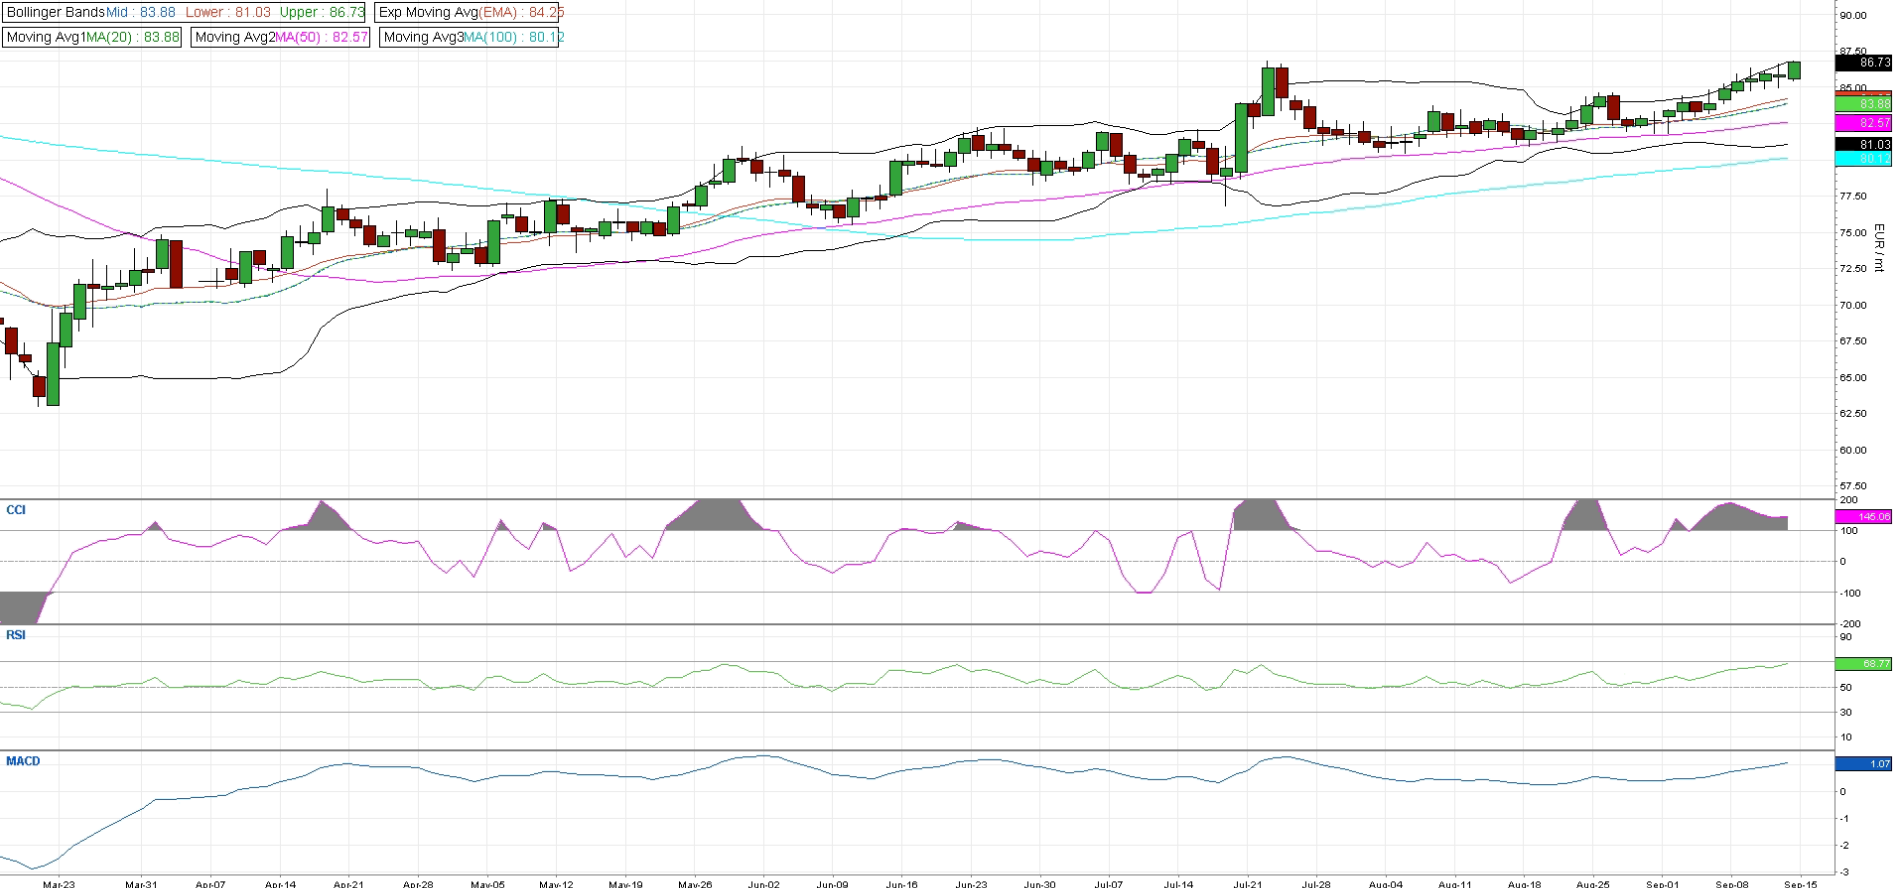
EUA Dec-26 price action remains constructive, with the contract trading clearly above the 20-day MA at €83.88, 50-day MA at €82.57 and 100-day MA at €80.12, maintaining a solid upward structure. Price is currently around €86.7, testing the upper Bollinger Band at €86.73 after a steady move higher. The immediate resistance area is therefore around €86.7–87.0, while a sustained break above this zone could bring the €87.5–90 area into focus. On the downside, €83.88 is the first meaningful support, followed by €82.57 and the lower Bollinger Band at €81.03. Momentum has strengthened noticeably, with RSI at 68.77 approaching overbought territory, while CCI at +145 indicates strong short-term buying momentum. The MACD at 1.07 is also positive and moving higher, supporting the current bullish structure. Given that Dec-26 is trading close to the upper Bollinger Band, some short-term consolidation cannot be excluded, but the technical picture remains mildly to moderately bullish while the contract holds above the €83.9–82.6 support zone.
The Dec-26 technical setup remains bullish, with €86.7–87.0 the key near-term resistance. A break above this area could bring €87.5–90 into focus, while rejection around the upper Bollinger Band could initially see the contract consolidate towards €83.9–82.6..
Chart B: December 2026 EUA Price (EUR) - Technical
AFS ENERGY B.V.
The information contained in the AFS Energy EU ETS Report, hereinafter Report, has been compiled or arrived from sources believed to be reliable but no representation or warranty, express or implied, is made as to their accuracy, completeness, timeliness, correct sequencing or correctness.
AFS Energy B.V. does not accept any liability, contingent otherwise for (i) the accuracy, completeness, timeliness or correctness of any information provided in the Report, (ii) any decision made, or action taken by you in reliance upon any of them and (iii) any direct or consequential loss arising from the use of the Report. AFS Energy B.V. does not make any representation or warranty about the suitability of the information in the Report.
The information contained in the Report is published for the assistance of the recipient but is not to be relied upon as authoritative or taken in substitution for the exercise of judgement by any recipient.