A leading environmental solution provider
Get in touch with usLast week, EUA Spot pricing increased 1.25% from Monday’s open (81.04) to Friday’s close (82.05); weekly high (82.94) / low (80.23) spread was €2.71.
Auction volume: 13.4 million EUAs, 2.3 million more than last week.
The fundamental backdrop is becoming increasingly supportive for EUAs through the energy complex. European gas storage has reached 61.7%, but this remains materially below historical levels for this point in the season. With TTF prices recently climbing to their highest levels since March, the market is increasingly pricing winter supply risk rather than simply current availability. Higher gas prices can improve the relative economics of coal generation, potentially increasing emissions and therefore EUA demand. At the same time, rising French nuclear availability should reduce some of the immediate pressure on European power markets, creating a counterweight to the gas-driven bullishness. Geopolitics remains the main wildcard. Iran has threatened to halt Gulf oil exports if the US economic offensive continues, while shipping through Hormuz remains severely disrupted. Although oil prices initially fell ahead of the new US sanctions announcement. For EUAs, this is a two-sided energy signal: prolonged disruption can keep gas and power prices elevated and support emissions, but a sufficiently severe energy shock could eventually suppress industrial activity and therefore compliance demand. Norway's willingness to continue Arctic drilling adds a longer-term supply response to Europe's energy-security problem. The return from the summer holiday period is arguably just as important for the carbon market itself. With liquidity expected to improve, the market should become more responsive to the underlying energy and policy signals. Positioning currently shows investment funds holding a net short of 38.66 million EUAs, down from 44.34 million a week earlier. The reduction in net shorts therefore came primarily from long liquidation rather than aggressive short covering. This suggests that funds have become less bearish overall, but conviction on the upside remains limited.
The fundamental picture for the coming week is moderately bullish for EUAs, led by elevated gas prices, tight storage and persistent geopolitical risk around LNG and Hormuz. Improving nuclear availability prevents the setup from becoming outright bullish, while the investment-fund positioning indicates that the market has not yet built a strong bullish consensus. With holiday liquidity returning, however, the combination of a tight energy complex and a still heavily short-positioned carbon market leaves room for upside repricing if gas remains elevated or geopolitical tensions intensify.
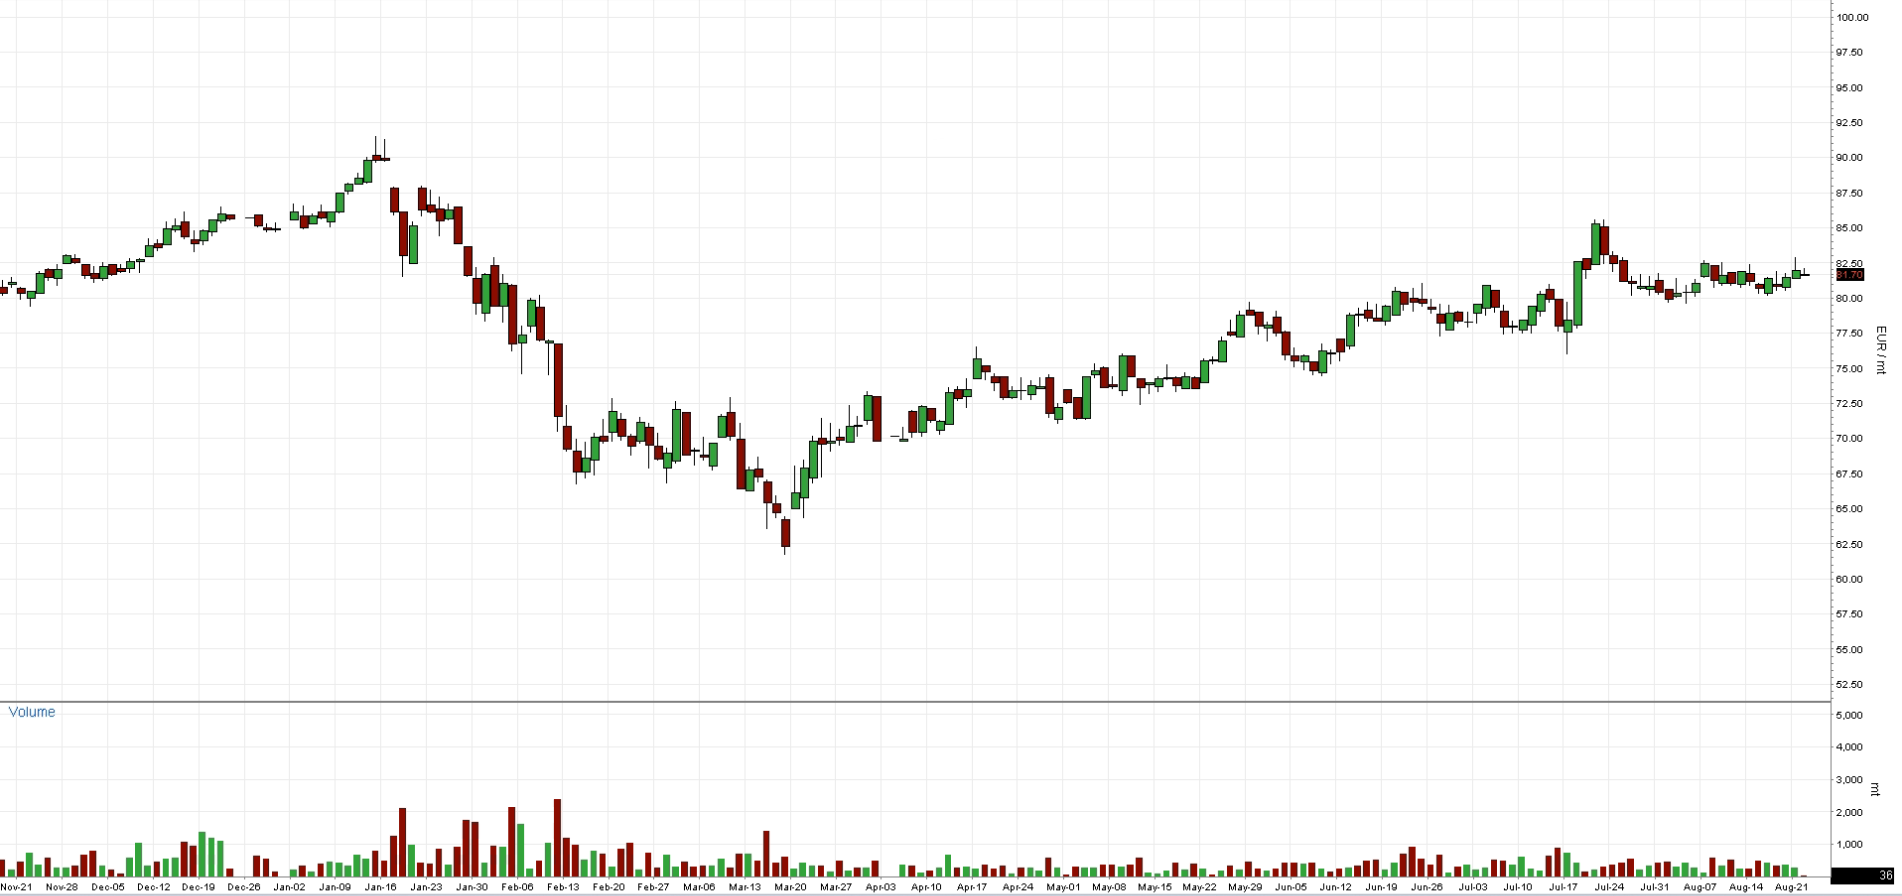
Chart A: EUA Spot (Futures Today) Price (EUR)
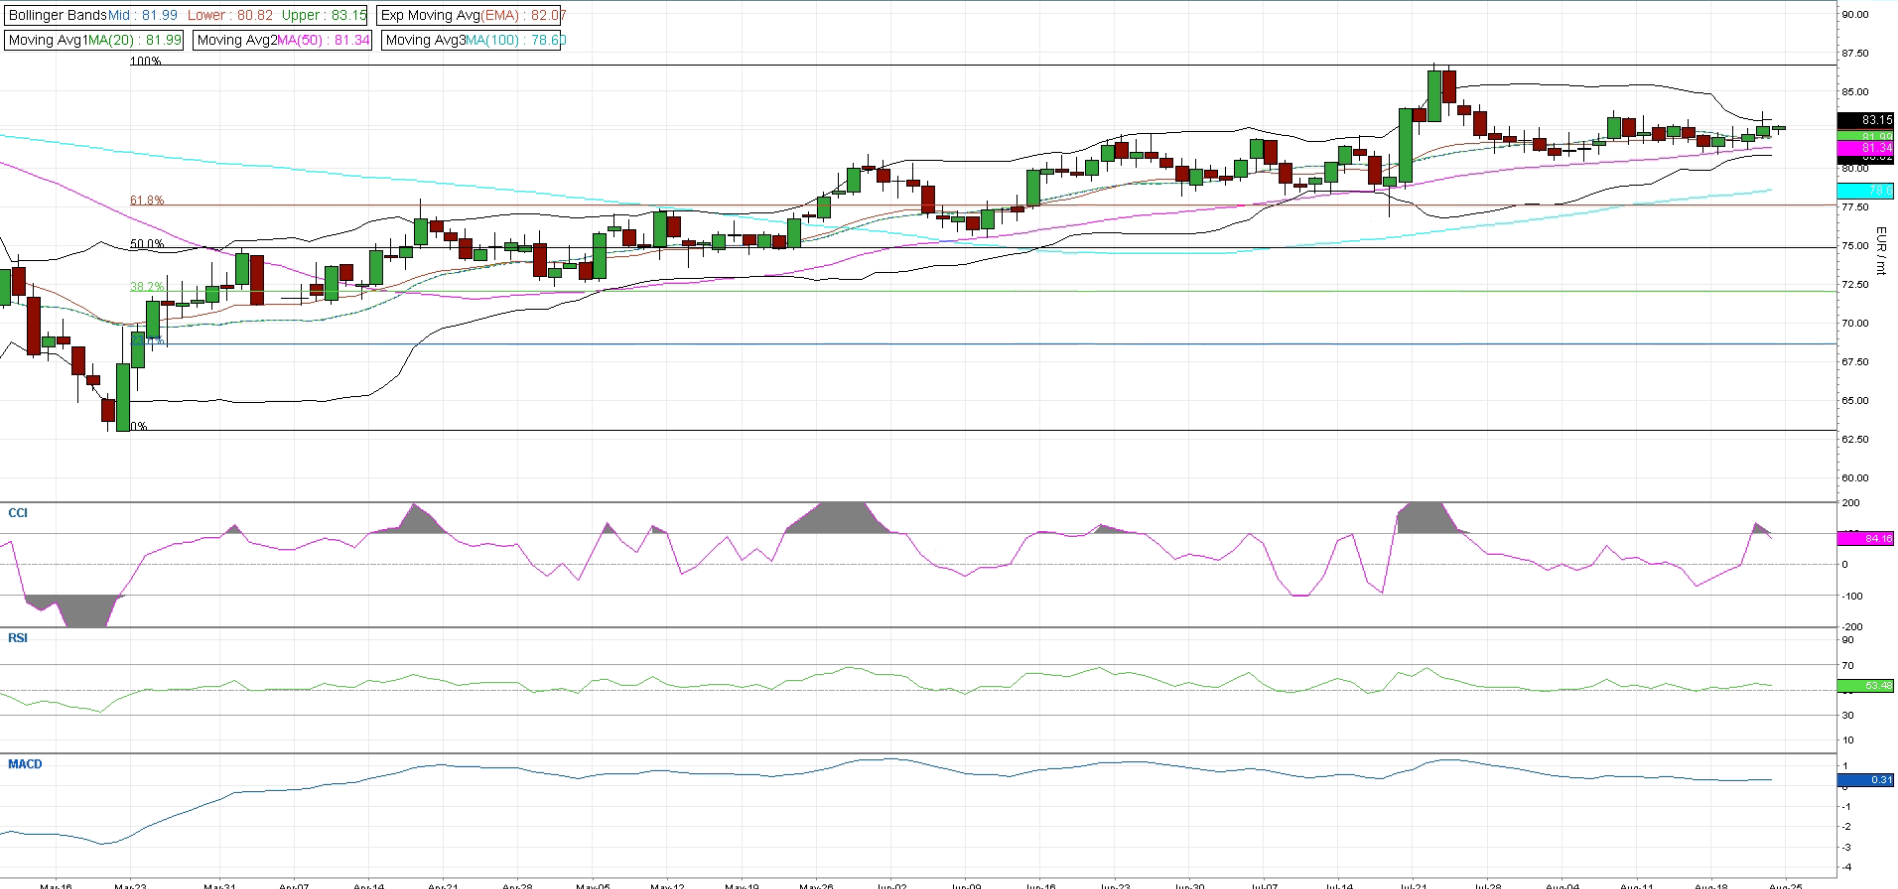
EUAs remain in a consolidation phase around €82–83 after the strong rally seen in July. Price is currently around €82.81 just above the 20-day MA and Bollinger mid at €81.99, while the 50-day MA sits at €81.34 and the 100-day MA at €78.60. This keeps the broader technical structure constructive, although the market has yet to convincingly break back towards the July highs. Momentum has improved slightly: RSI is at 53.5, indicating neutral territory with a modest positive tilt, while CCI has recovered to +84, suggesting short-term momentum is picking up again. MACD remains positive at 0.31, although relatively flat, pointing more towards consolidation than a strong directional move. The key levels remain fairly clear. €83.15–84.00 is the immediate resistance area, with a break above this zone opening the way towards the €84.88 upper Bollinger Band and subsequently the previous high around €86. On the downside, €81.99 is the first important support, followed by the €81.34 50-day MA. Below that, €79.88 becomes increasingly important, with the €78.60 100-day MA providing the broader trend support.
The technical picture remains neutral to mildly bullish. Price is holding above the major moving averages and momentum indicators are beginning to turn higher, but a sustained move above €83–84 is needed to re-establish stronger upside momentum. Conversely, a break below €81.34–79.88 would increasingly point towards a deeper correction.
Chart B: December 2026 EUA Price (EUR) - Technical
AFS ENERGY B.V.
The information contained in the AFS Energy EU ETS Report, hereinafter Report, has been compiled or arrived from sources believed to be reliable but no representation or warranty, express or implied, is made as to their accuracy, completeness, timeliness, correct sequencing or correctness.
AFS Energy B.V. does not accept any liability, contingent otherwise for (i) the accuracy, completeness, timeliness or correctness of any information provided in the Report, (ii) any decision made, or action taken by you in reliance upon any of them and (iii) any direct or consequential loss arising from the use of the Report. AFS Energy B.V. does not make any representation or warranty about the suitability of the information in the Report.
The information contained in the Report is published for the assistance of the recipient but is not to be relied upon as authoritative or taken in substitution for the exercise of judgement by any recipient.