

A leading environmental solution provider
Get in touch with usAuction volume: 11.1 million EUAs, 3.4 million more than last week.
The EUA market enters the week with a somewhat conflicting energy backdrop. Gas storage has climbed to 60.8%, but inventories remain historically low for this point in the summe. Reuters recently described European storage as being at its lowest mid-year level on record, while the ongoing disruption around Hormuz continues to add uncertainty to LNG flows. For the coming week, the gas-carbon relationship therefore remains an important upside driver: sustained gas strength could improve coal-to-gas switching economics and provide support for EUAs, even if outright demand remains subdued. French nuclear availability is expected to fall to its lowest level in three years, with heat-related restrictions taking around 15% of the French nuclear fleet offline at the peak. Lower nuclear output is already lifting power prices and encouraging additional coal and gas generation in neighbouring markets: a fundamentally supportive setup for EUA demand. At the same time, record solar generation is limiting some of that thermal demand, creating a tug-of-war between weather-driven nuclear outages and increasingly strong renewable output. Dutch coal generation moving higher is nevertheless a notable bearish-to-bullish signal for emissions, as it suggests that high power-system stress is translating into additional fossil generation. Geopolitics remains the biggest swing factor. US-Iran negotiations are struggling to make progress and shipping through Hormuz has slowed sharply, keeping both oil and gas markets sensitive to further escalation. Meanwhile, the EU is preparing a significantly broader Russia sanctions package for the autumn, potentially adding another layer of pressure to European energy markets. For EUAs, this creates a two-sided dynamic: higher energy prices and additional fossil generation are supportive, but prolonged energy stress can simultaneously weigh on industrial output and therefore compliance demand.
For the week ahead, the fundamental backdrop leans moderately supportive for EUAs, but the signal is far from one-directional. Tight gas balances, weaker French nuclear availability and higher coal generation provide upside pressure, while thin summer liquidity, softer industrial activity and continued de-risking can cap the move. The key variable is likely to remain the gas–power complex: if European gas continues higher without a significant deterioration in industrial demand, the carbon market has room to regain some ground after last week's decline.
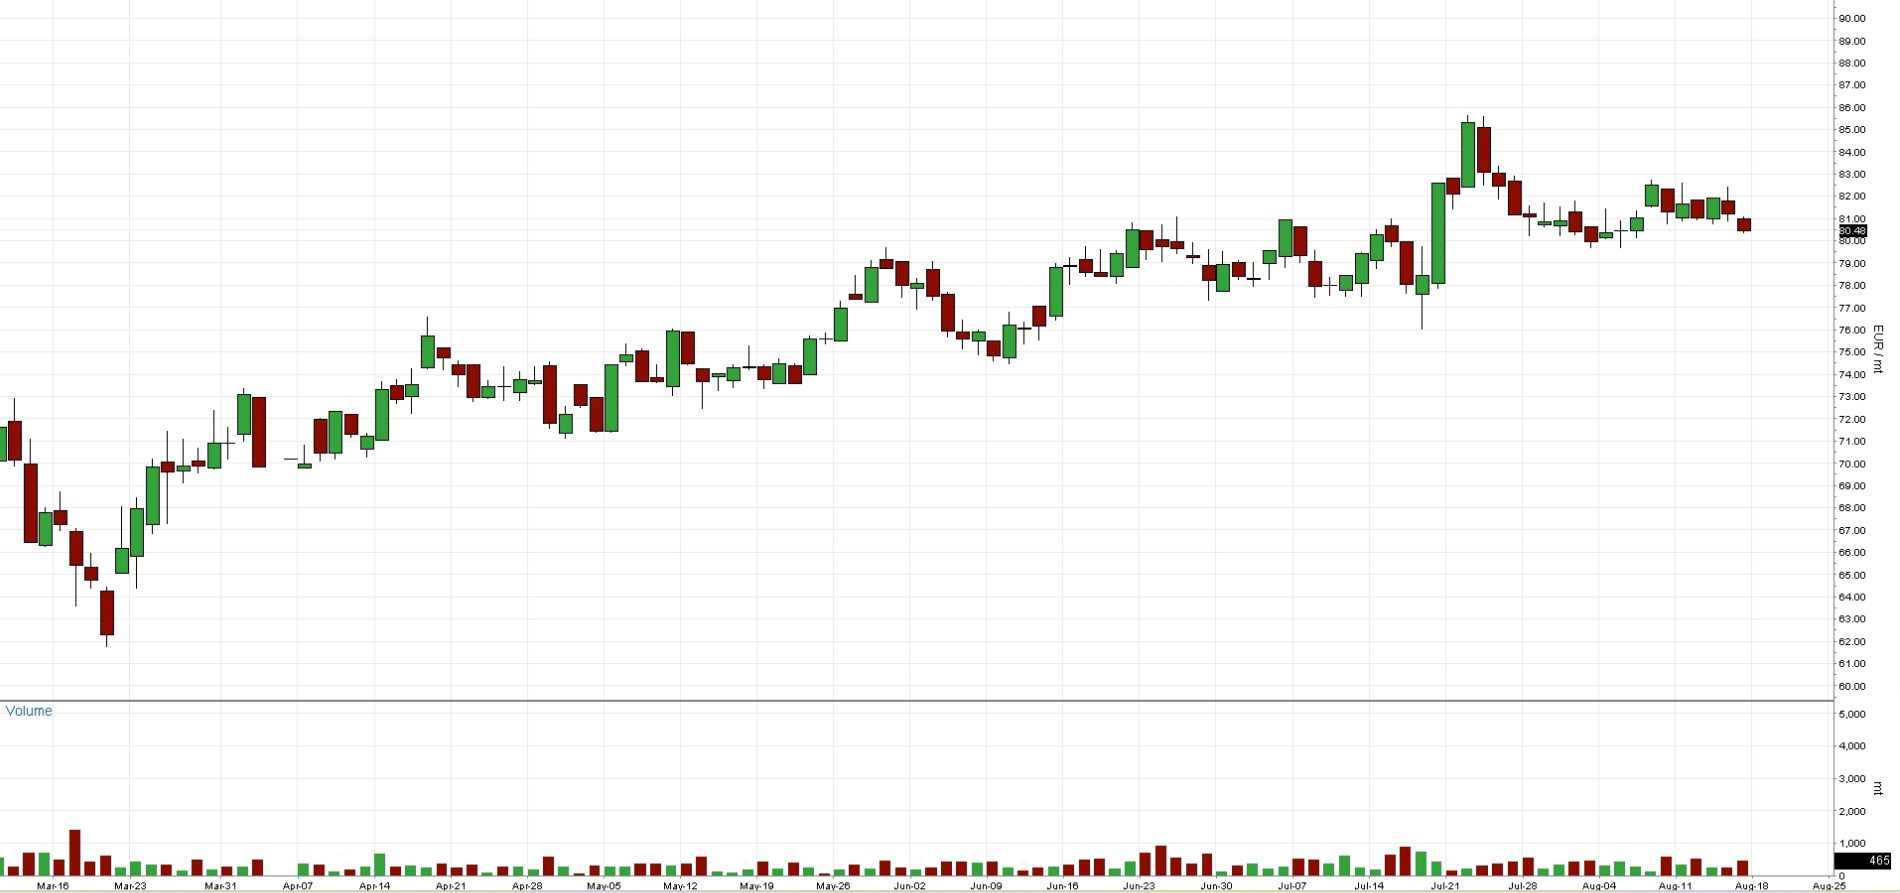
Chart A: EUA Spot (Futures Today) Price (EUR)
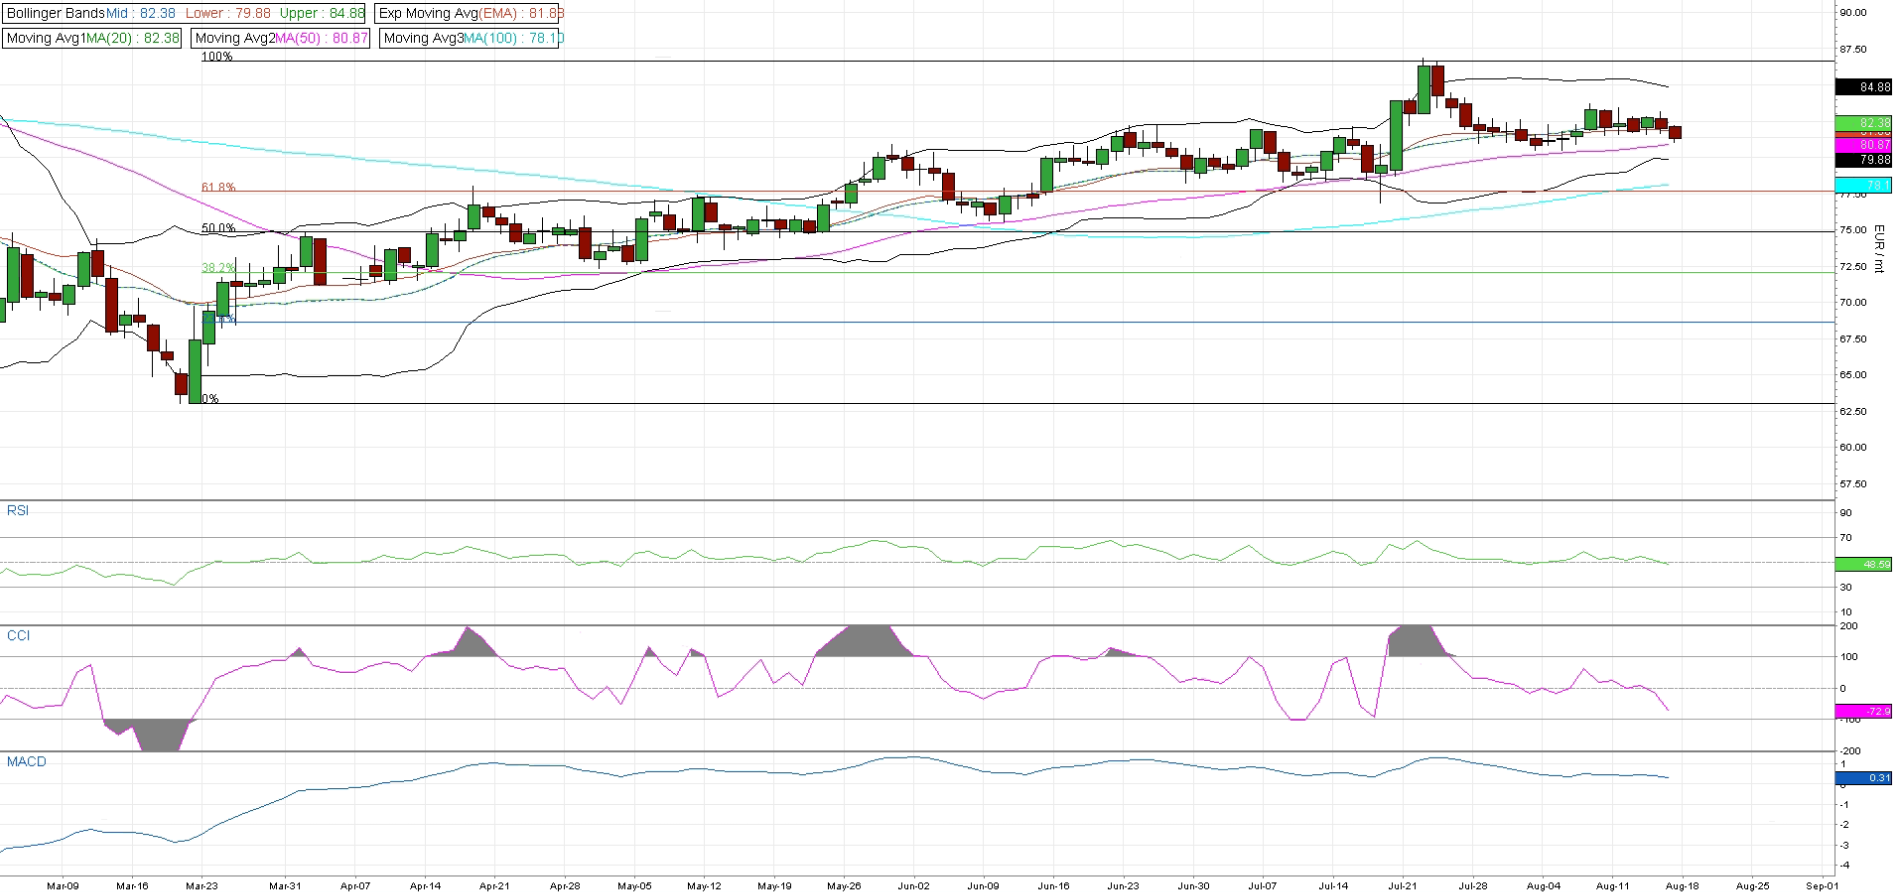
EUAs remain in a consolidation phase after the sharp July rally. Price is currently around €81.5–82, sitting just below the 20-day MA/Bollinger mid at €82.38 and around the EMA at €81.8. The failure to reclaim €82.38 keeps the very short-term momentum somewhat neutral, although the broader structure remains constructive as price is still above the 50-day MA at €80.87 and 100-day MA at €78.10. Momentum has cooled considerably: RSI at 48.6 is neutral, while CCI at -72.9 points to some short-term weakness. MACD remains positive at 0.31, but is flattening, suggesting that the previous bullish momentum is losing some strength rather than fully reversing. From a levels perspective, €82.38 is the immediate pivot/resistance. A sustained move above this level would bring €84.88, the upper Bollinger Band, back into focus, followed by the recent high around €85.2. On the downside, €80.87 is the first important support, followed by €79.88 and then the €78.10 100-day MA. A break below €78.10 would materially weaken the current upward structure.
Technically, the picture is neutral to mildly constructive. The market is consolidating rather than clearly reversing, with €82.38 acting as the key trigger on the upside and €80.87–79.88 forming the main near-term support zone. As long as price above that zone remains, the broader upward structure is intact, while a break below it would increase the likelihood of a deeper retracement.
Chart B: December 2026 EUA Price (EUR) - Technical
AFS ENERGY B.V.
The information contained in the AFS Energy EU ETS Report, hereinafter Report, has been compiled or arrived from sources believed to be reliable but no representation or warranty, express or implied, is made as to their accuracy, completeness, timeliness, correct sequencing or correctness.
AFS Energy B.V. does not accept any liability, contingent otherwise for (i) the accuracy, completeness, timeliness or correctness of any information provided in the Report, (ii) any decision made, or action taken by you in reliance upon any of them and (iii) any direct or consequential loss arising from the use of the Report. AFS Energy B.V. does not make any representation or warranty about the suitability of the information in the Report.
The information contained in the Report is published for the assistance of the recipient but is not to be relied upon as authoritative or taken in substitution for the exercise of judgement by any recipient.


