

A leading environmental solution provider
Get in touch with usAuction volume: 13.4 million EUAs, 4.3 million more than last week.
The European carbon market enters the week caught in a structural tug-of-war, with bearish macroeconomic pressures and regulatory sentiment counterbalancing bullish support from heat-driven power demand and energy market geopolitical risks. Industrial demand remains constrained as extreme summer climate conditions leak into broader economic metrics. Record-breaking June and July temperatures across Western Europe have disrupted economic activity, leading analysts to warn of a tangible drag on 2026 EU GDP growth. Slower growth directly dampens industrial production, capping baseline compliance demand from energy-intensive installations. Additionally, market sentiment has been softened by analysts revising their 2026–2027 EUA price forecasts downward in response to ongoing EU market reform proposals, while minor activity level updates in the UK ETS offer negligible immediate market impact. On the power generation side, short-term burn demand provides a firm counterweight to these macro headwinds. Sustained heatwaves have elevated cooling demand across the continent, driving up fossil-fuel dispatch during periods of reduced hydro output and thermal plant cooling constraints. With EU gas storage currently sitting at 58.8%, a prolonged cooling load tightens gas balances and lifts marginal generation costs, indirectly supporting EUA prompt prices. This dynamics is further amplified by geopolitical friction in the broader energy complex. Escalating tensions around the Strait of Hormuz,stemming from a lack of agreement between Oman and Iran and Iranian demands for US concessions, continue to push crude oil higher. Geopolitical risk premiums in oil and TTF gas historically trigger defensive carbon hedging among European utilities, limiting downward price momentum.
Looking ahead to the coming week, EUA prices are expected to trade within a range-bound channel with a slight upside bias. While macroeconomic weakness and regulatory recalibrations prevent aggressive bullish breakouts, heatwave-driven power demand and energy market volatility should establish a strong price floor. In the short term, EUA directional movement will likely be dictated by TTF gas swings and geopolitical headlines out of the Middle East rather than immediate compliance purchasing.
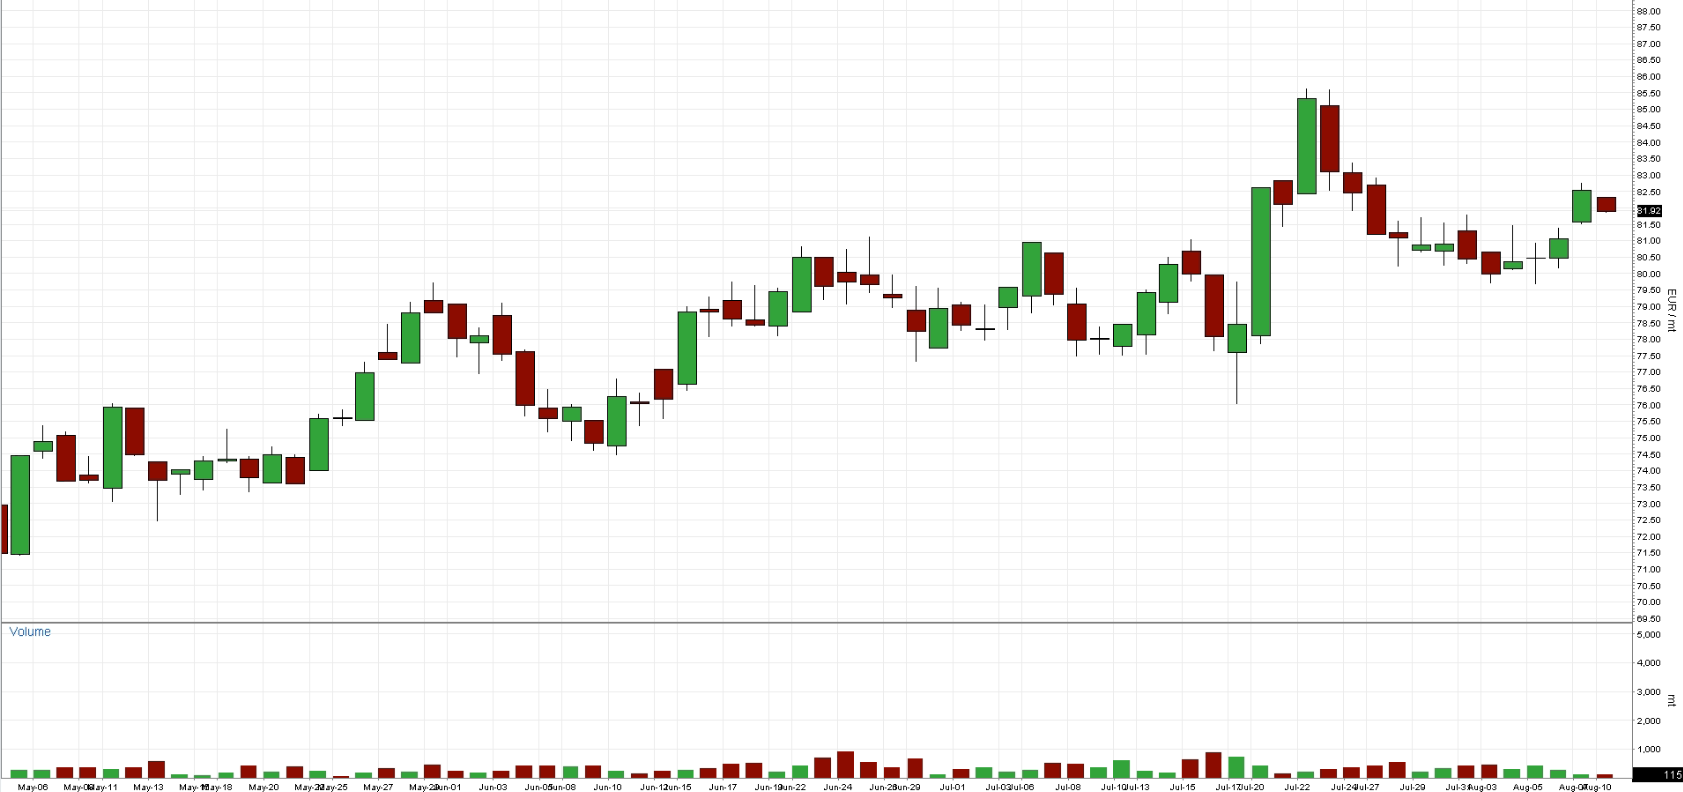
Chart A: EUA Spot (Futures Today) Price (EUR)
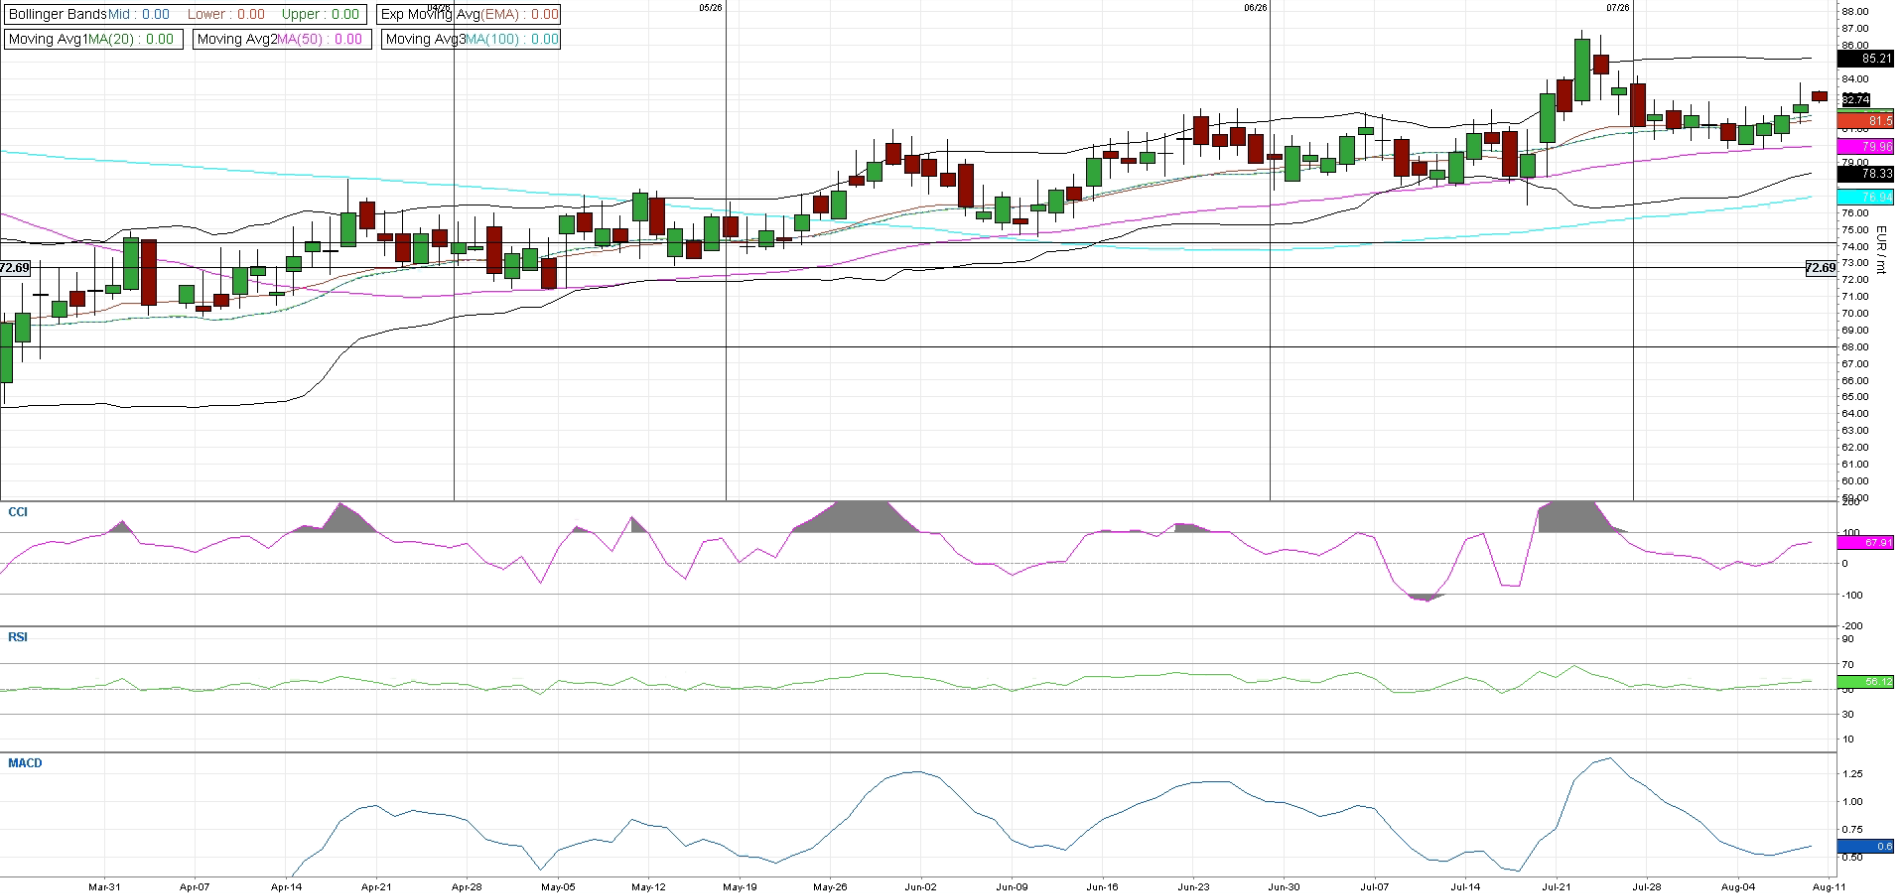
Dec26 EUA pricing remains in a constructive short-term structure, with price currently around €82.60. Following the sharp move towards €86, the market has entered a consolidation phase, but importantly price continues to trade above the key moving averages. The 20-day MA at €81.50 is currently the first meaningful support, followed by the 50-day MA at €79.96 and the lower Bollinger Band around €78.33. The 100-day MA at €76.94 remains well below the market, keeping the broader trend positive. The Bollinger Bands indicate that the recent volatility has started to ease after the strong upside move. Price is now positioned in the upper half of the band, with the upper Bollinger Band at €85.21 marking the main technical resistance. Momentum indicators remain supportive but have cooled from their recent highs: RSI at 56.1 is neutral-to-positive, while CCI at +67.9 points to recovering momentum without yet being overbought. The MACD around 0.60 has stabilised and is beginning to turn higher, suggesting that downside momentum is losing some traction.
The technical picture remains mildly bullish as long as €81.50 holds. A move through €85.20 would reopen the recent highs around €86 and strengthen the upside structure. Conversely, a break below €81.50 would make €79.96 the next important level, with €78.33 providing further downside support. Overall, the chart currently points more towards consolidation within an upward structure than a clear trend reversal.
Chart B: December 2026 EUA Price (EUR) - Technical
AFS ENERGY B.V.
The information contained in the AFS Energy EU ETS Report, hereinafter Report, has been compiled or arrived from sources believed to be reliable but no representation or warranty, express or implied, is made as to their accuracy, completeness, timeliness, correct sequencing or correctness.
AFS Energy B.V. does not accept any liability, contingent otherwise for (i) the accuracy, completeness, timeliness or correctness of any information provided in the Report, (ii) any decision made, or action taken by you in reliance upon any of them and (iii) any direct or consequential loss arising from the use of the Report. AFS Energy B.V. does not make any representation or warranty about the suitability of the information in the Report.
The information contained in the Report is published for the assistance of the recipient but is not to be relied upon as authoritative or taken in substitution for the exercise of judgement by any recipient.


