

A leading environmental solution provider
Get in touch with usAuction volume: 13.4 million EUAs, 4.3 million more than last week.
This week's market narrative has shifted away from immediate supply fears and towards the future shape of the EU carbon market. The pause in US military action against Iran has eased concerns over disruptions in the Strait of Hormuz, leading to a sharp decline in both oil and European gas prices. With gas storage now standing at 55.4%, supply conditions continue to improve, reducing the energy-driven support that has underpinned EUA prices in recent months. As a result, the market has entered a more cautious, risk-off phase following several weeks of elevated geopolitical premiums. Attention has instead turned to Brussels, where negotiations on the next phase of the EU ETS have exposed deep political divisions. While several Member States, including Germany and Poland, are pushing for greater flexibility to protect industrial competitiveness, others such as Sweden argue that weakening the system would undermine Europe's long-term climate ambitions. At the same time, proposals to broaden carbon pricing across sectors, the continued debate around maritime emissions, and growing scrutiny of international trade impacts underline that the ETS is still evolving rather than being dismantled. Investors appear to be recognising this distinction, with many viewing the current reform discussions as an opportunity to improve the system rather than fundamentally reduce future carbon demand.
For EUA prices, the coming week is likely to be driven primarily by political headlines rather than energy fundamentals. Softer oil and gas prices may continue to limit upside in the short term, but the market remains highly sensitive to signals emerging from the ETS reform negotiations. Should policymakers demonstrate that competitiveness measures will be accompanied by a credible long-term carbon framework, sentiment could stabilise quickly. Until greater clarity emerges, however, traders are likely to remain cautious, keeping EUA prices largely rangebound while awaiting the next major policy catalyst.
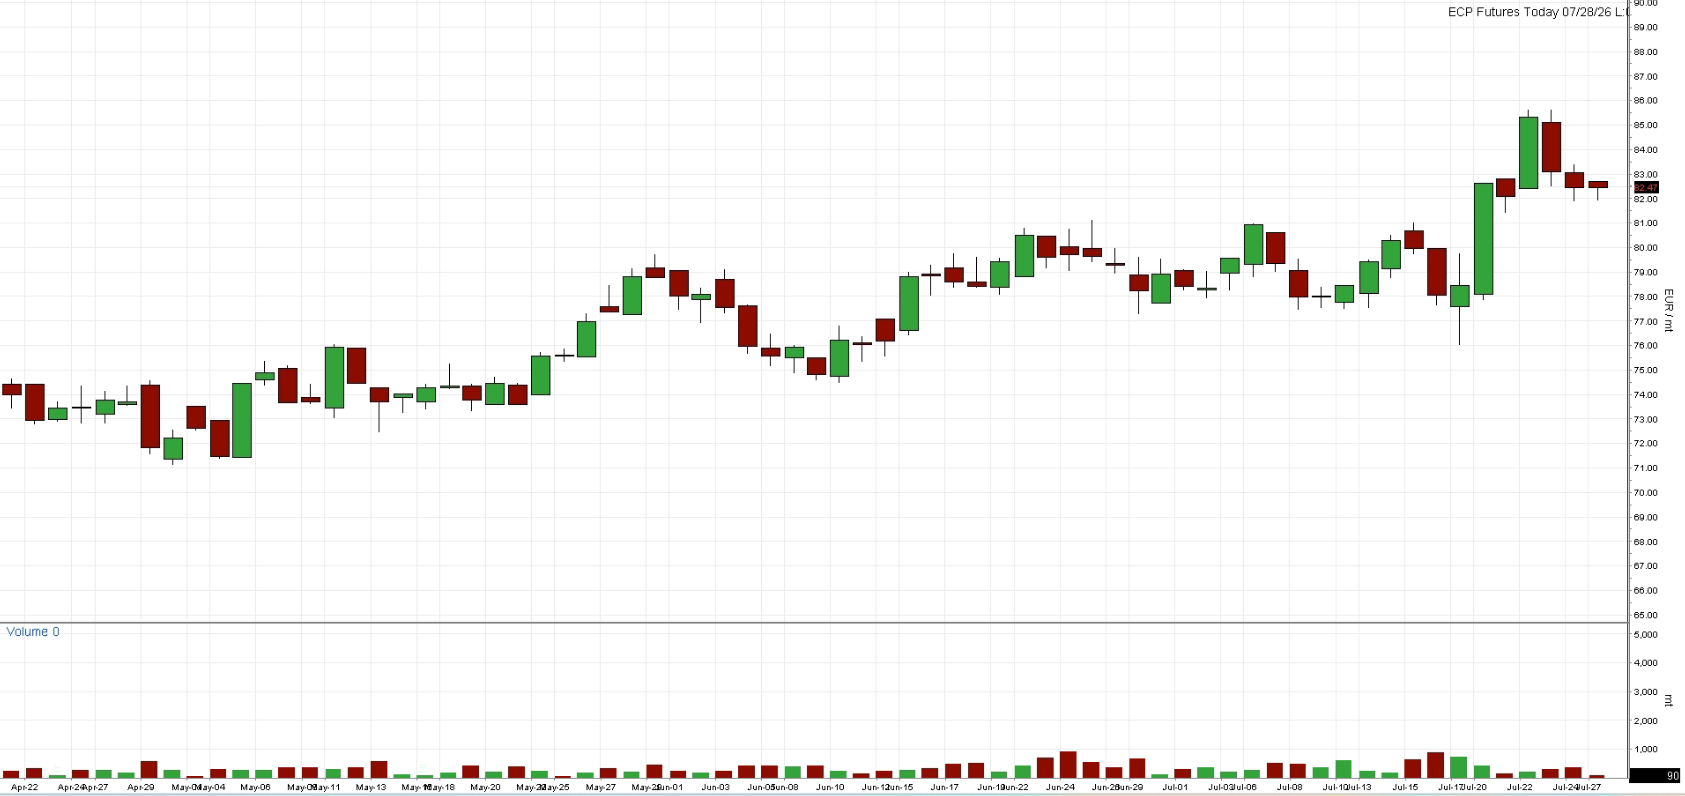
Chart A: EUA Spot (Futures Today) Price (EUR)
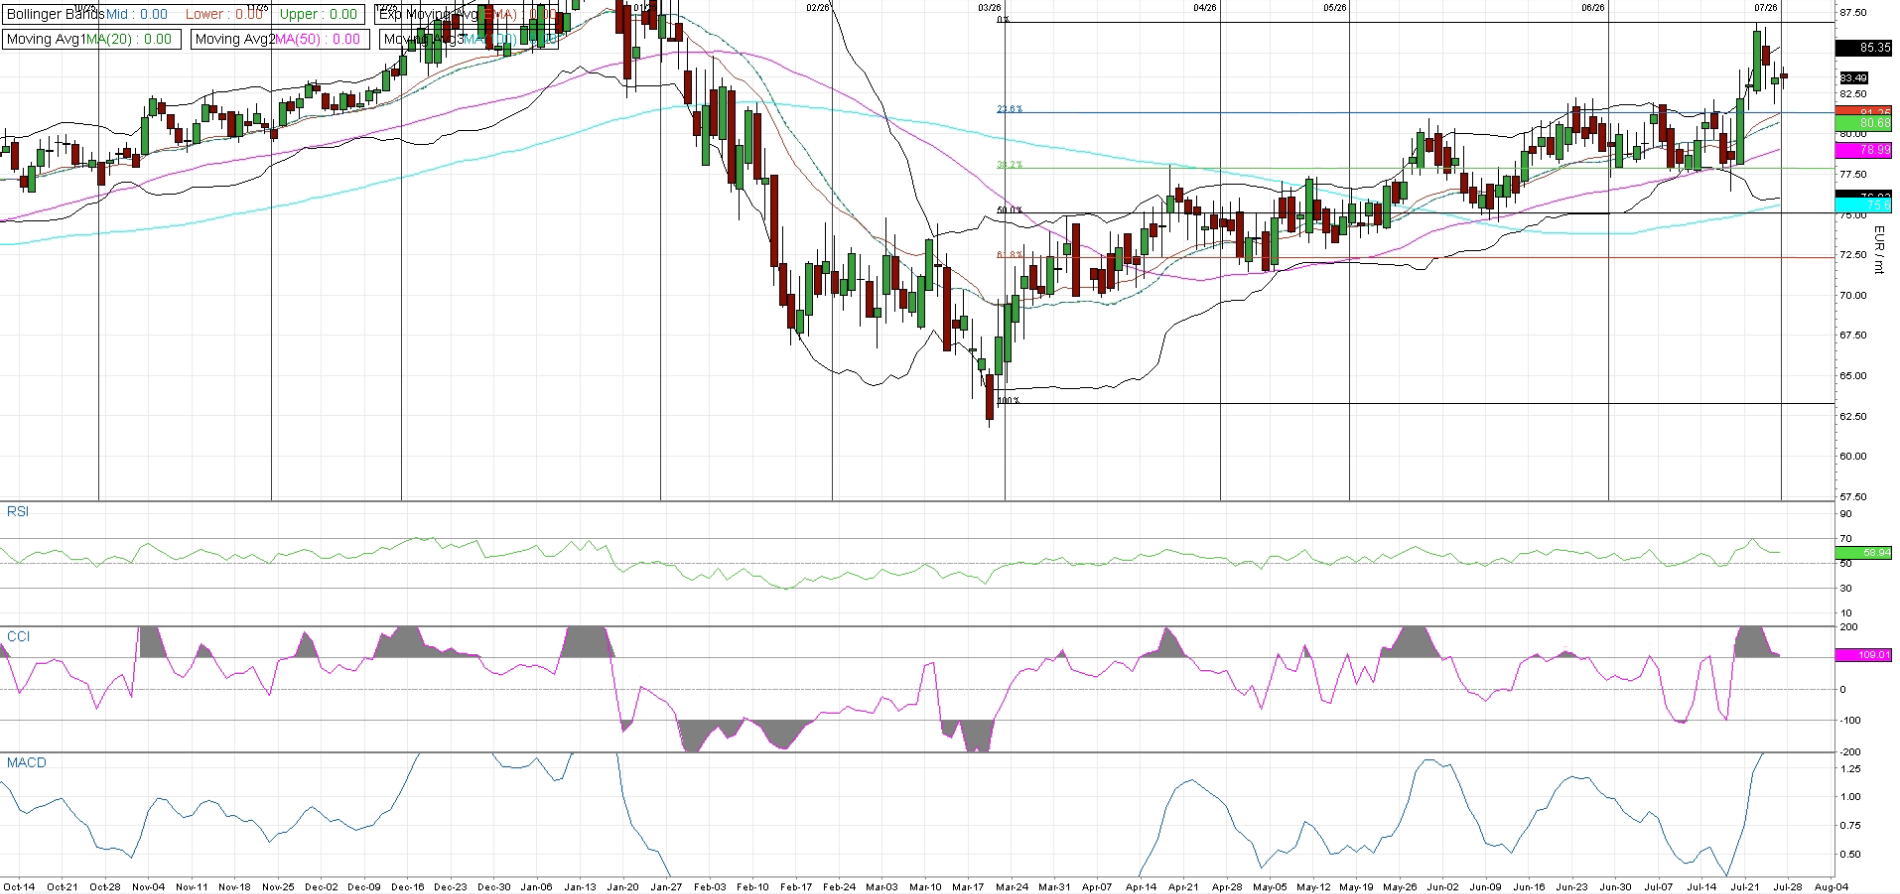
December 2026 EUAs remain in a constructive medium-term uptrend despite last week's rejection from the €86.90 resistance high. Price continues to trade comfortably above the 20-day moving average (€80.68), 50-day moving average (€78.99) and 100-day moving average (€75.40), confirming that the broader trend remains positive. The recent pullback has so far respected the €80.70–81.20 support zone, suggesting buyers continue to defend higher levels. The Bollinger Bands indicate that last week's rally briefly became overstretched after moving above the upper band, with price now returning within the bands. RSI has eased to around 69, remaining close to overbought territory, while CCI stays firmly positive, reflecting strong underlying momentum. MACD continues to trend higher and remains in positive territory, indicating that bullish momentum is still intact despite the recent consolidation.
The technical picture remains cautiously bullish while prices hold above the 20-day moving average at €80.68. A sustained break above €85.35 would strengthen the current uptrend and open the door for further gains. Conversely, a move below €78.99 would be the first indication that bullish momentum is beginning to fade, potentially leading to a broader consolidation phase.
Chart B: December 2026 EUA Price (EUR) - Technical
AFS ENERGY B.V.
The information contained in the AFS Energy EU ETS Report, hereinafter Report, has been compiled or arrived from sources believed to be reliable but no representation or warranty, express or implied, is made as to their accuracy, completeness, timeliness, correct sequencing or correctness.
AFS Energy B.V. does not accept any liability, contingent otherwise for (i) the accuracy, completeness, timeliness or correctness of any information provided in the Report, (ii) any decision made, or action taken by you in reliance upon any of them and (iii) any direct or consequential loss arising from the use of the Report. AFS Energy B.V. does not make any representation or warranty about the suitability of the information in the Report.
The information contained in the Report is published for the assistance of the recipient but is not to be relied upon as authoritative or taken in substitution for the exercise of judgement by any recipient.


