A leading environmental solution provider
Get in touch with usAuction volume: 11.1 million EUAs, 2.8 million more than last week.
This week's market is being shaped by two opposing forces. On one hand, escalating geopolitical tensions continue to support the broader energy complex. Attacks in the Azov Sea, renewed Ukrainian drone strikes, and rising uncertainty around the Strait of Hormuz have reduced tanker traffic and increased floating LNG storage, pushing oil prices higher. Although European gas storage has improved to 53.7%, supply risks remain firmly on traders' radar, helping to maintain an underlying risk premium across energy markets. At the same time, the focus has increasingly shifted back to European climate policy. The European Commission unveiled a broad package of proposals aimed at strengthening industrial competitiveness while preserving the long-term integrity of the EU ETS. Discussions around moderating the pace of emission reductions for industry have initially been perceived as easing compliance costs. However, these proposals are accompanied by measures that reinforce future carbon demand, including support for industrial electrification, an expansion of the ETS to smaller maritime vessels, and continued integration of the shipping sector. Support from both the shipping and cement industries suggests the market is viewing the reforms as an evolution of the ETS rather than a weakening of the system.
For EUA prices, the coming week is likely to be driven less by immediate compliance demand and more by how investors interpret the Commission's reform package. While any perception of regulatory relief could temporarily weigh on sentiment, the broader direction remains one of expanding carbon pricing across additional sectors. Combined with ongoing geopolitical uncertainty supporting the wider energy complex, the medium-term backdrop remains constructive, even if prices continue to consolidate in the near term as the market digests the latest policy proposals.
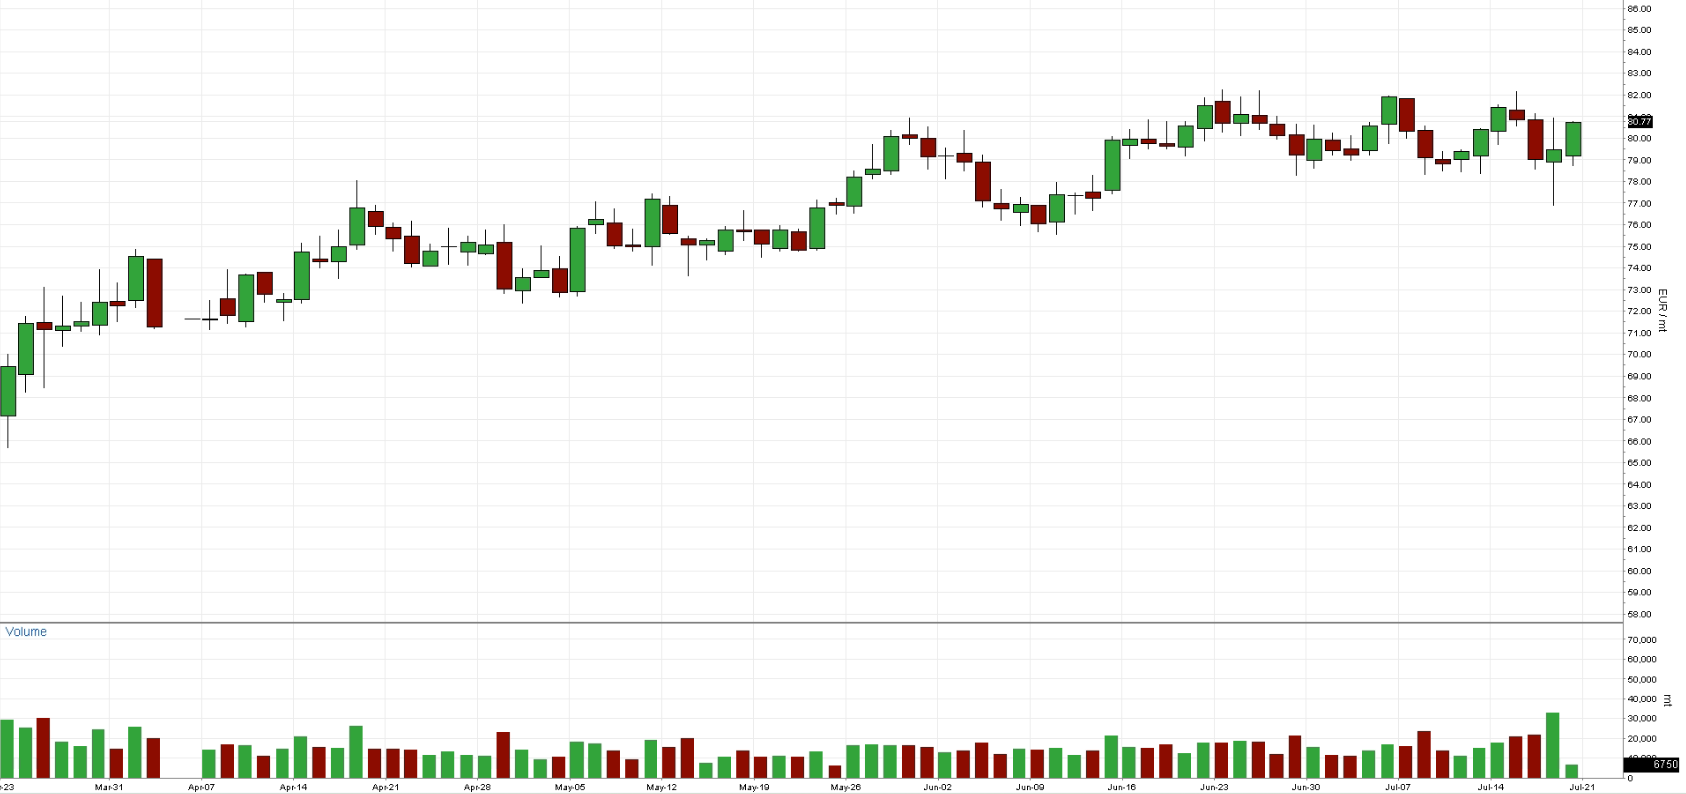
Chart A: EUA Spot (Futures Today) Price (EUR)
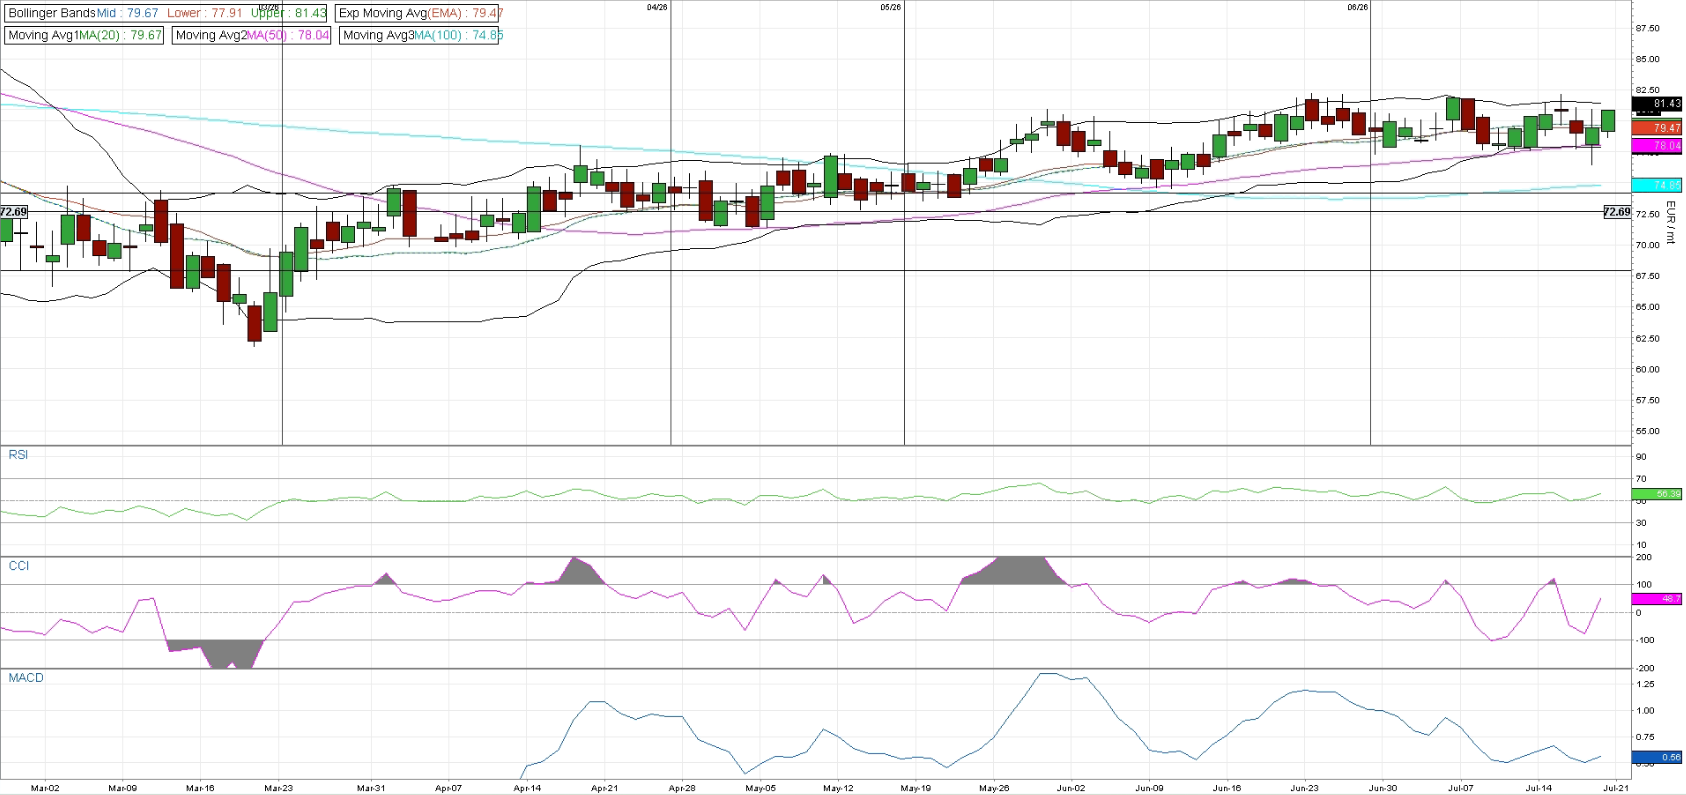
December 2026 EUAs continue to trade within a well-defined consolidation range following the strong recovery from the March lows. Price remains above both the 50-day moving average (€78.04) and the 100-day moving average (€74.85), preserving the constructive medium-term structure. While the market has struggled to establish a decisive break above recent highs, buyers continue to defend pullbacks, resulting in a sequence of higher lows that keeps the broader bias cautiously positive. The Bollinger Bands have narrowed further, reflecting declining volatility and a market waiting for a fresh catalyst. Price is trading around the 20-day moving average (€79.67) and the EMA (€79.47), indicating equilibrium between buyers and sellers. The upper Bollinger Band at €81.43 continues to act as the first key resistance, while the lower band around €77.91 provides immediate support. A break outside this range is likely to determine the next directional move. Momentum indicators remain broadly neutral. RSI is holding around 56, suggesting there is still room for further upside without entering overbought territory. CCI has recovered back into positive territory after briefly weakening, pointing to improving short-term momentum, while MACD remains above zero, although the histogram has flattened, indicating bullish momentum has moderated rather than reversed.
The technical picture remains cautiously constructive as long as price holds above the €78.50 region, supported by the rising 50-day moving average. A sustained break above €81.43 would strengthen the bullish case and could trigger another leg higher. Conversely, a move below €77.91 would increase the likelihood of a deeper correction toward the 100-day moving average near €74.85, although the broader medium-term trend would remain intact unless that level is decisively broken.
Chart B: December 2026 EUA Price (EUR) - Technical
AFS ENERGY B.V.
The information contained in the AFS Energy EU ETS Report, hereinafter Report, has been compiled or arrived from sources believed to be reliable but no representation or warranty, express or implied, is made as to their accuracy, completeness, timeliness, correct sequencing or correctness.
AFS Energy B.V. does not accept any liability, contingent otherwise for (i) the accuracy, completeness, timeliness or correctness of any information provided in the Report, (ii) any decision made, or action taken by you in reliance upon any of them and (iii) any direct or consequential loss arising from the use of the Report. AFS Energy B.V. does not make any representation or warranty about the suitability of the information in the Report.
The information contained in the Report is published for the assistance of the recipient but is not to be relied upon as authoritative or taken in substitution for the exercise of judgement by any recipient.