We collaborate to achieve sustainable success
A leading environmental solution provider
Get in touch with usAFS Energy EU ETS Market Report - Week 3 2026

Do you want to receive to-the-minute up to date info? Please sign up to our client portal and/or to the Viridian Exchange.
European energy and commodity markets continued to feel the effects of soft gas fundamentals this week, as natural gas futures slipped further amid warm weather forecasts across major consumption regions. U.S. natural gas futures recently plunged sharply on milder forecasts and strong production, undercutting heating demand expectations and contributing to broader downward pressure on fuel costs. Although EU TTF prices have been historically low at times amid ample supply and rising LNG flows, cooler forecasts for the coming weeks may introduce some volatility that could support emissions from the power sector. These dynamics keep EUAs sensitive to short‑term fuel‑switching between gas and coal, especially if gas prices rebound on weather or supply shifts.
On the carbon policy side, the EU published its revised 2026 EU ETS auction calendar, reflecting adjustments such as maritime emissions inclusions and allowance cancellations tied to surrender shortfalls, which will influence supply into the 2026 market year. Meanwhile, broader structural drivers continue to support the medium‑term outlook for the ETS, with auction volumes and Market Stability Reserve dynamics expected to tighten supply relative to demand, even as near‑term EUA prices remain influenced by natural gas and energy market volatility. Draft adjustments to the Market Stability Reserve and continued debate around sector coverage (including ETS2 launch pacing) may also shape future price expectations among compliance buyers and speculators.
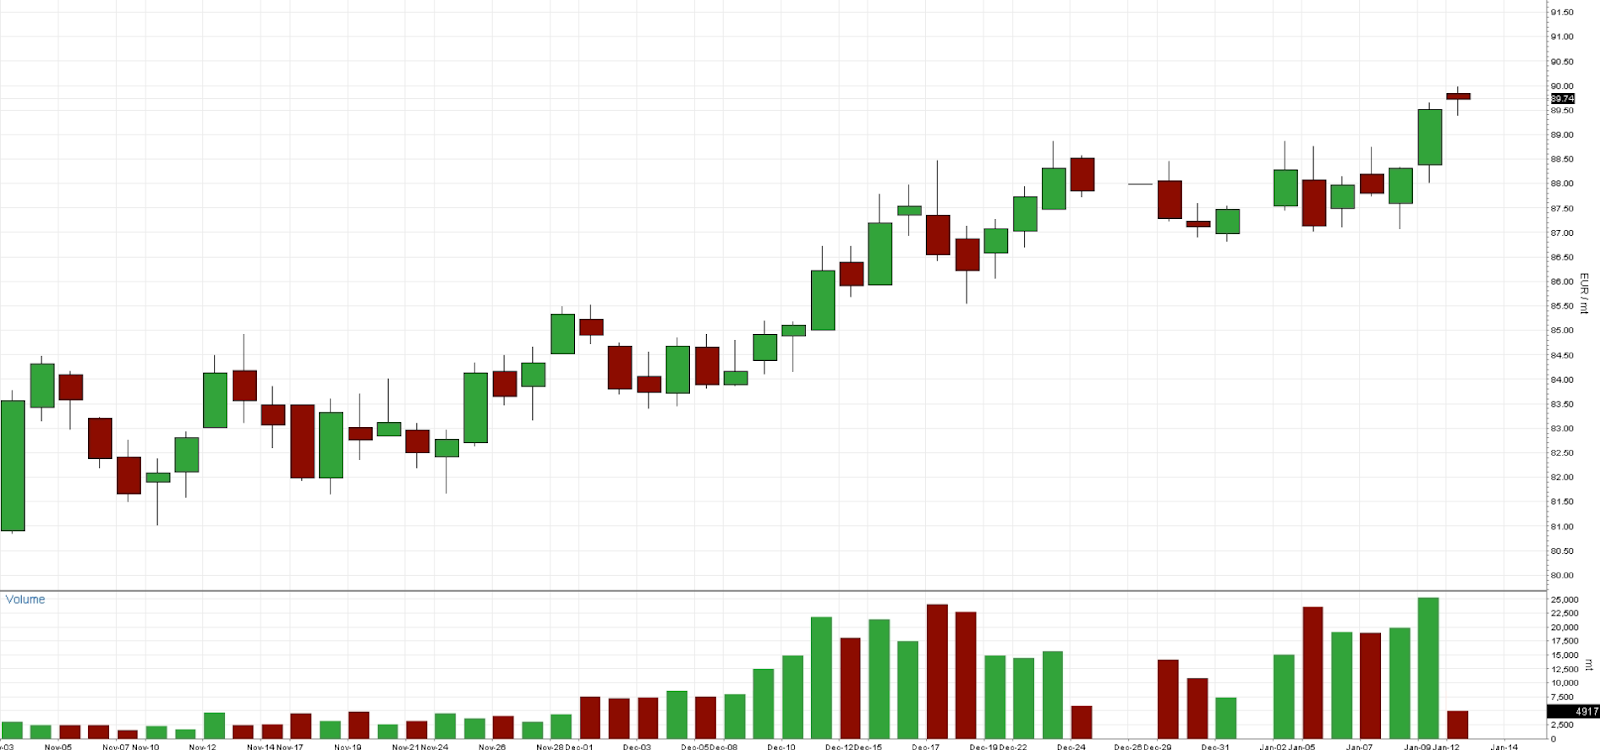
Auction volume: 9.23 million EUAs, 3.9 million more than last week.
Energy Fundamentals
- Gas storage currently sits at 54.9% (January 10, 2026)
- Big Oil offers reality check to Trump’s Venezuela dream
- Oil prices dip in Iran following weekend of protests
- Flow of US LNG to Europe likely to rise this year – industry
- Atlantic LNG rates dip to $48,000 per day
- Revised 2026 EU ETS auction calendars published
- Trump’s shadow looms over EU aviation emissions plan
- Germany’s emissions trading revenues rise to record 21.4 billion euros
- Commission proposes targeted adjustments to the Market Stability Reserve Decision to support a smoother start for ETS2
- Mild Winter, Healthy Supply Drive Natural Gas Futures to New Lows
Investment Funds
- Investment funds increased their net long position to +114.98m EUAs on January 2nd (vs. +116.16m EUAs on December 26th).
- Gross short positions slightly increased to -28.72m EUAs (vs -27.9m EUAs).
- Gross long positions decreased to 143.7m EUAs (vs. 144.06m EUAs).
Market Prices:
- Indicative Dec26 EUA Price: € 89.60
- Indicative Spot EUA Price: €87.54
- YTD Spot EUA Price: € 74.366
- MTD Spot EUA Price: € 85.627
Chart A: December 2026 EUA Price (EUR)
Technical Analysis
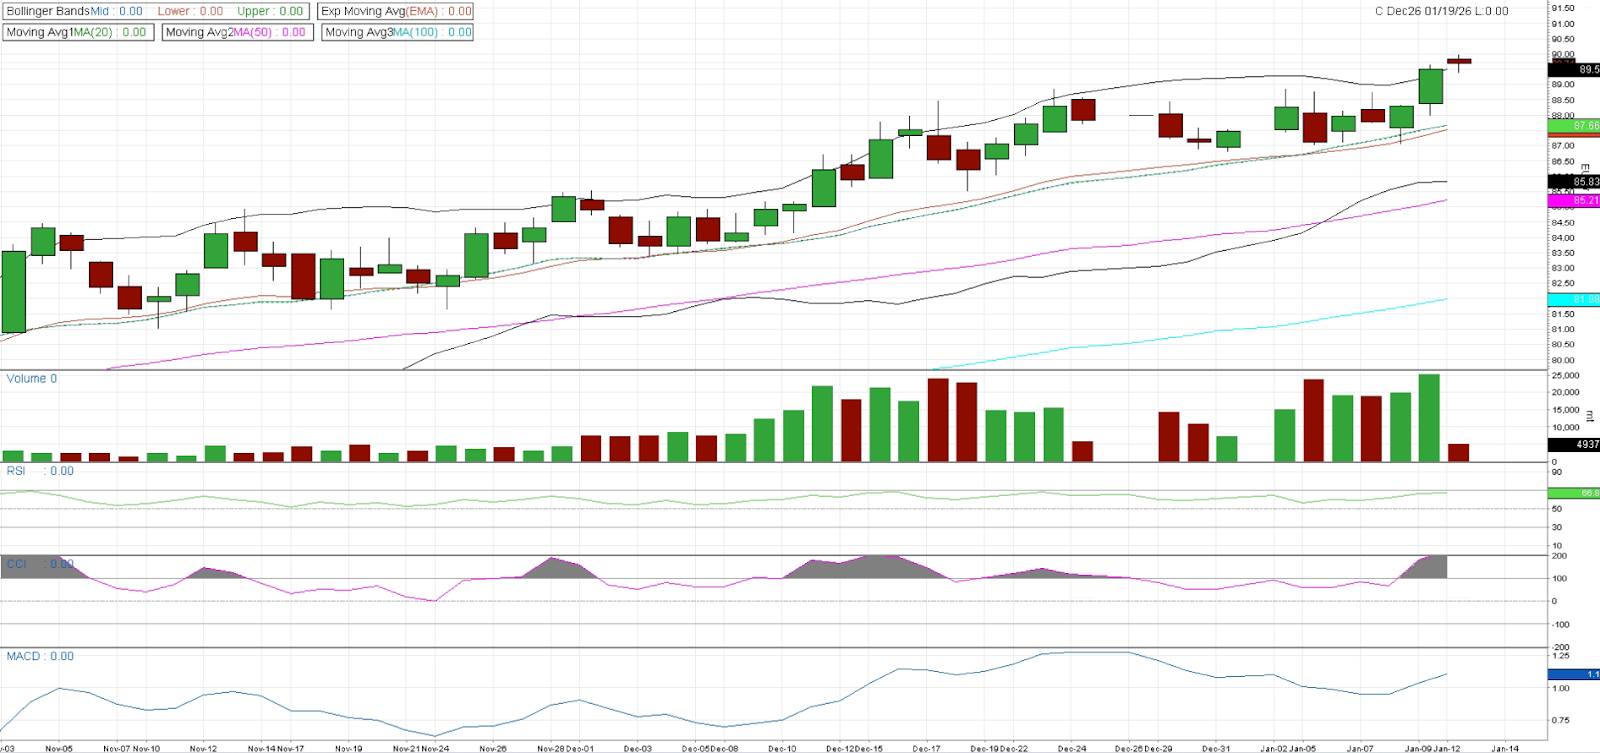
Price action in Dec-26 EUAs has re-asserted its upside bias this week, with the contract pushing to fresh highs and closing near the upper end of the recent range. The broader rising channel remains intact, and price is again pressing toward the upper Bollinger Band. The moving average structure remains firmly constructive.
MACD remains positive, with the histogram holding above zero and beginning to turn higher again. This suggests momentum is stabilising after the recent pause and supports the case for continued trend progression rather than a rollover. RSI has firmed back into the mid-to-high 60s, reflecting renewed upside momentum without yet signalling overbought conditions. CCI has turned higher and is again elevated in positive territory, indicating improving directional momentum, though historically such levels can still accommodate brief consolidation phases without undermining the trend. From a Fibonacci extension perspective, the recent swing from the early November low to the mid-December high suggests that the next potential upside targets lie near the 161.8% extension of that move. This aligns with the contract pressing toward recent highs, reinforcing the notion that a break above this zone could accelerate the trend toward further Fibonacci-derived targets. Conversely, shallow pullbacks to key retracement levels (38.2–50% of the prior leg) may offer constructive buying opportunities within the ongoing uptrend.
Overall, the technical structure remains constructive, with price holding above key short- and medium-term averages and momentum indicators supportive. As long as pullbacks remain shallow and supported above the MA20/MA50 zone, the upside bias is maintained. A sustained break and acceptance above recent highs would reinforce the bullish narrative, while any near-term consolidation should be viewed as digestion within an ongoing uptrend rather than a sign of trend failure.
Chart B: December 2026 EUA Price (EUR) - Technical
AFS ENERGY B.V.
The information contained in the AFS Energy EU ETS Report, hereinafter Report, has been compiled or arrived from sources believed to be reliable but no representation or warranty, express or implied, is made as to their accuracy, completeness, timeliness, correct sequencing or correctness.
AFS Energy B.V. does not accept any liability, contingent otherwise for (i) the accuracy, completeness, timeliness or correctness of any information provided in the Report, (ii) any decision made, or action taken by you in reliance upon any of them and (iii) any direct or consequential loss arising from the use of the Report. AFS Energy B.V. does not make any representation or warranty about the suitability of the information in the Report.
The information contained in the Report is published for the assistance of the recipient but is not to be relied upon as authoritative or taken in substitution for the exercise of judgement by any recipient.

