A leading environmental solution provider
Get in touch with usAuction volume: 9.45 million EUAs, 2.53 less than last week.
Market sentiment continues to be shaped by the balance between easing supply concerns and persistent geopolitical uncertainty. European gas storage has climbed to 48.2%, reflecting steady progress in the injection season and gradually reducing concerns over winter preparedness. Under normal circumstances, this would weigh modestly on energy and carbon prices. However, the market remains reluctant to fully price out geopolitical risk. That uncertainty is largely driven by developments outside Europe. Oil prices rebounded following renewed US and Iranian strikes in the Middle East, although reports of both countries agreeing to resume negotiations have prevented a more pronounced risk premium from developing. Meanwhile, continued fighting in Ukraine and Russia's acknowledgment of domestic fuel shortages reinforce the view that global energy markets remain vulnerable to unexpected supply disruptions. Within Europe, attention is increasingly shifting back toward climate policy. France and Italy are pushing for reforms that reduce fossil fuel dependence while revisiting aspects of the EU ETS, as Ireland prepares to facilitate negotiations on what could become one of the bloc's most significant climate debates this year. At the same time, record-breaking heat across Europe has renewed the focus on energy security and decarbonisation, supporting the longer-term role of carbon pricing despite ongoing discussions around policy adjustments.
Overall, the near-term outlook for EUA prices remains finely balanced. Improving gas inventories provide a modest bearish influence, while geopolitical uncertainty and continued commitment to Europe's climate agenda offer underlying support. Unless either energy markets or ETS policy deliver a decisive surprise, EUA prices are likely to remain driven by headline risk and evolving expectations around the second half of 2026.
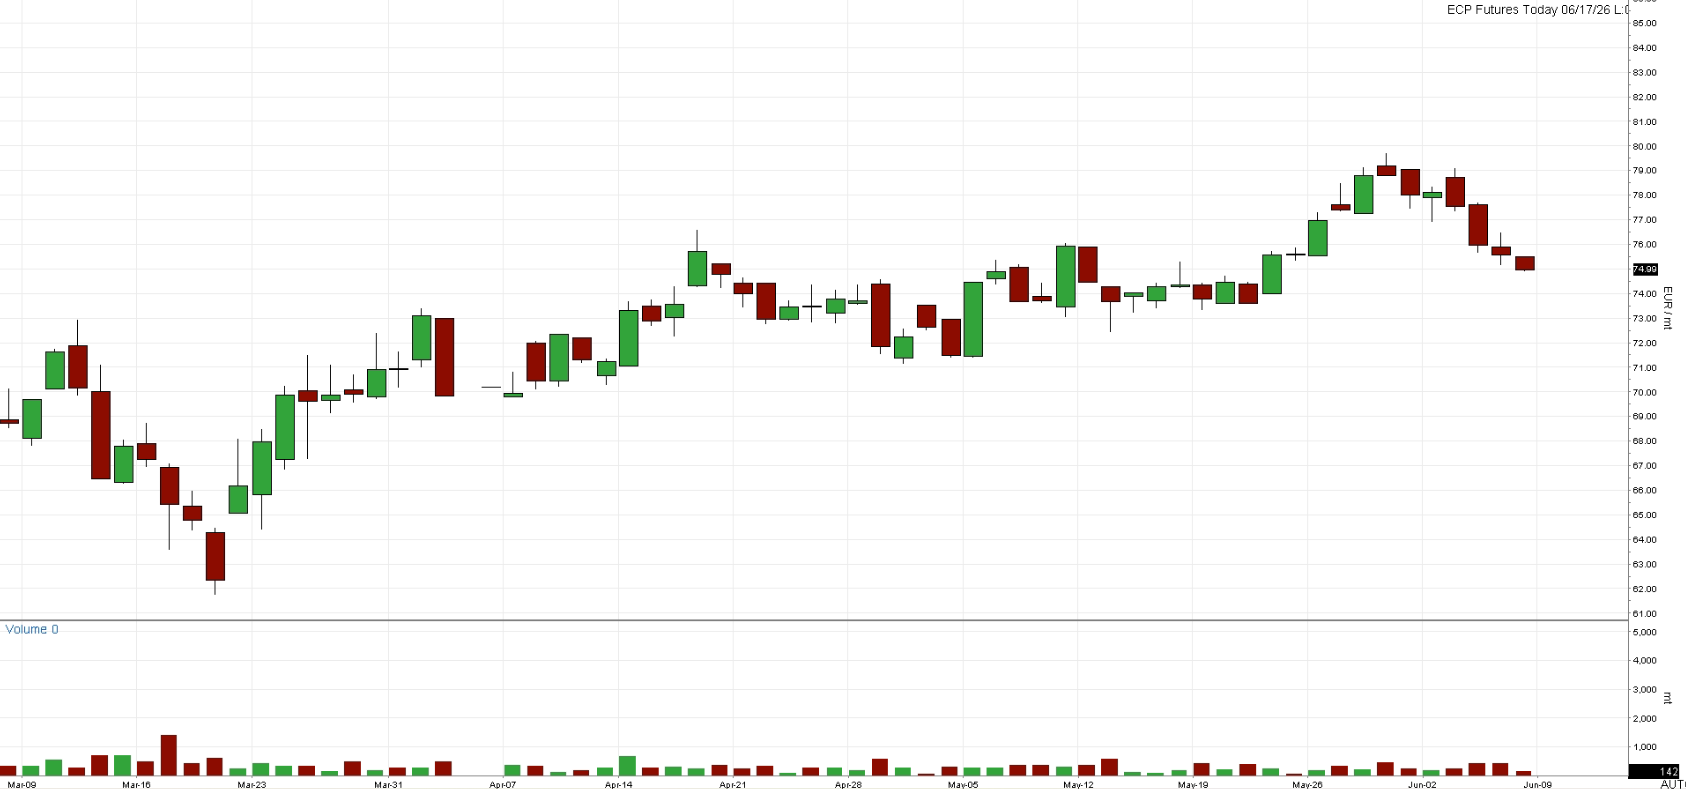
Chart A: EUA Spot (Futures Today) Price (EUR)
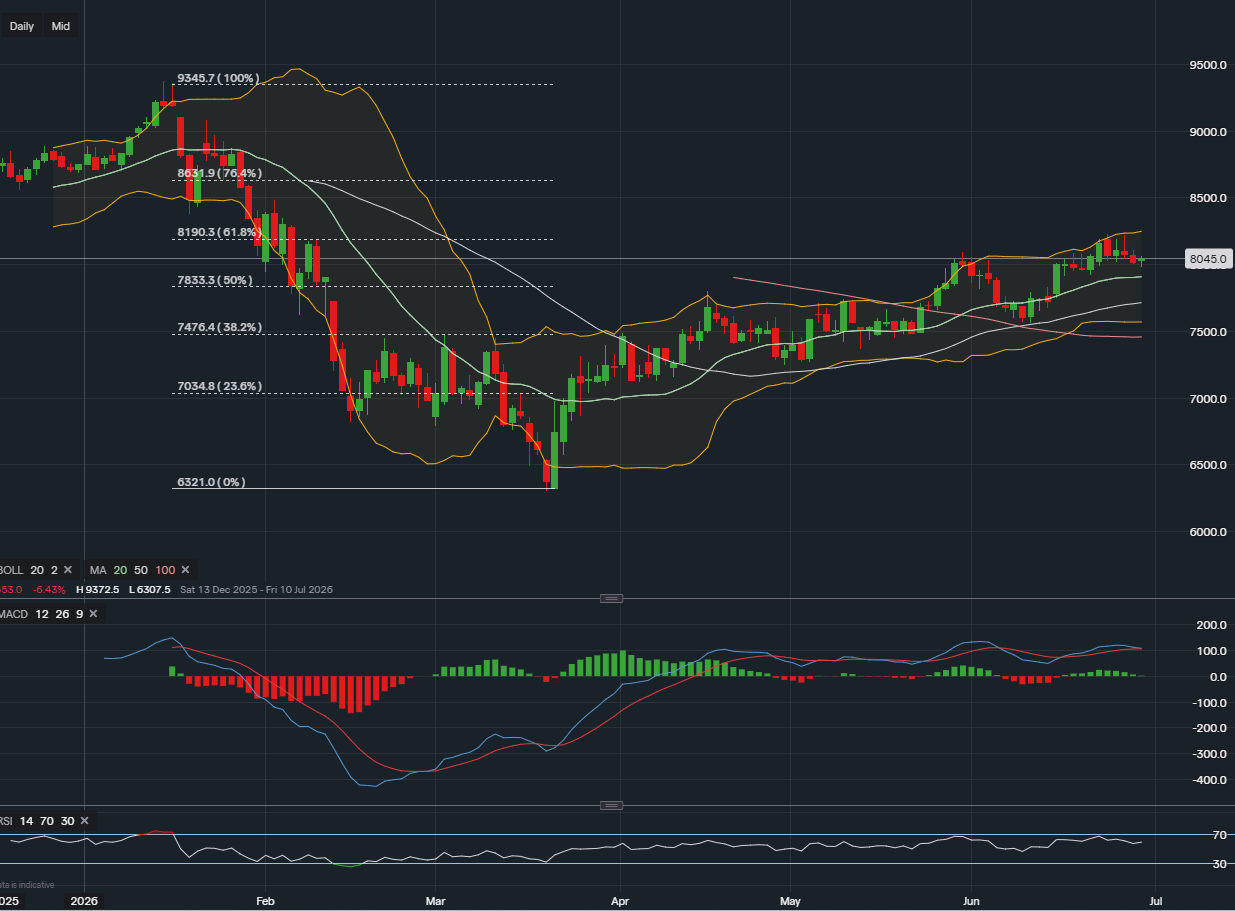
Technically, EUAs have sustained their upward momentum above a key psychological milestone, with the Dec-26 contract grinding higher to trade around the EUR 80.45 level. This incremental appreciation solidifies the structural breakout above the 50% Fibonacci retracement level, extending the well-defined pattern of higher local lows and maintaining a dominant topside regime.
The EUR 80.00 handle, alongside the 50% Fibonacci retracement at EUR 78.33, continues to function as a formidable structural support zone. Momentum indicators demonstrate that while immediate velocity has moderated, the broader trend remains firmly intact; the MACD lines continue to hover constructively above the zero line with a flattening histogram showing a brief consolidation of strength, while the RSI holds steady at 62, indicating durable buyer control with sufficient capacity for further upside extension before encountering overbought conditions.
From a purely technical perspective, the price action is hugging the upper quadrant of the Bollinger Bands, which remain oriented upward to accommodate the positive trend. The primary upside objective remains a direct test of the heavy liquidity cluster at the 61.8% Fibonacci retracement level near EUR 81.90. Conversely, any near-term profit-taking or mean-reversion pullbacks are expected to find robust insulation at the EUR 78.33 macro floor and the ascending 20-day moving average.
Chart B: December 2026 EUA Price (EUR) - Technical
AFS ENERGY B.V.
The information contained in the AFS Energy EU ETS Report, hereinafter Report, has been compiled or arrived from sources believed to be reliable but no representation or warranty, express or implied, is made as to their accuracy, completeness, timeliness, correct sequencing or correctness.
AFS Energy B.V. does not accept any liability, contingent otherwise for (i) the accuracy, completeness, timeliness or correctness of any information provided in the Report, (ii) any decision made, or action taken by you in reliance upon any of them and (iii) any direct or consequential loss arising from the use of the Report. AFS Energy B.V. does not make any representation or warranty about the suitability of the information in the Report.
The information contained in the Report is published for the assistance of the recipient but is not to be relied upon as authoritative or taken in substitution for the exercise of judgement by any recipient.