

A leading environmental solution provider
Get in touch with usAuction volume: 11.98 million EUAs, 1.38 more than last week.
The fundamental backdrop for EUA prices has turned somewhat more balanced, with easing energy market pressures offset by continued structural support from climate policy. European gas storage has risen to 44.3% as of June 13th, improving confidence around winter preparedness. In addition, the announcement of a US-Iran deal and President Trump’s comments that it would “let the oil flow” have weighed on both oil and gas prices, reducing the geopolitical risk premium that had supported energy markets in recent months. Growing concerns over rising oil inventories further reinforce the view that supply conditions may become more comfortable, which could limit upside pressure on EUA prices in the near term. Despite softer energy prices, the policy backdrop remains broadly supportive for carbon markets. EU member states have agreed to extend CBAM to downstream sectors from 2028, while the UK has confirmed changes to its ETS auction calendar to accommodate maritime inclusion. These developments underline the continued expansion of carbon pricing mechanisms and support the longer-term demand outlook for emissions allowances. Meanwhile, legal challenges to the EU’s carbon removal framework and attempts in the US to roll back emissions regulations highlight that climate policy remains politically contested, but they do not materially alter the broader direction of travel. Geopolitical risks have also moderated somewhat. Progress on the Iran deal and Russia’s willingness to engage with US peace proposals have eased some concerns surrounding global energy supply disruptions. As a result, the strong bullish impulse provided by geopolitical tensions earlier this year has weakened. Overall, the near-term outlook for EUA prices appears relatively neutral. Higher storage levels and easing energy prices provide a modest bearish influence, while the continued strengthening and expansion of carbon market mechanisms offer underlying structural support. This combination suggests a more range-bound environment, with market sentiment likely remaining sensitive to both energy prices and future policy developments.
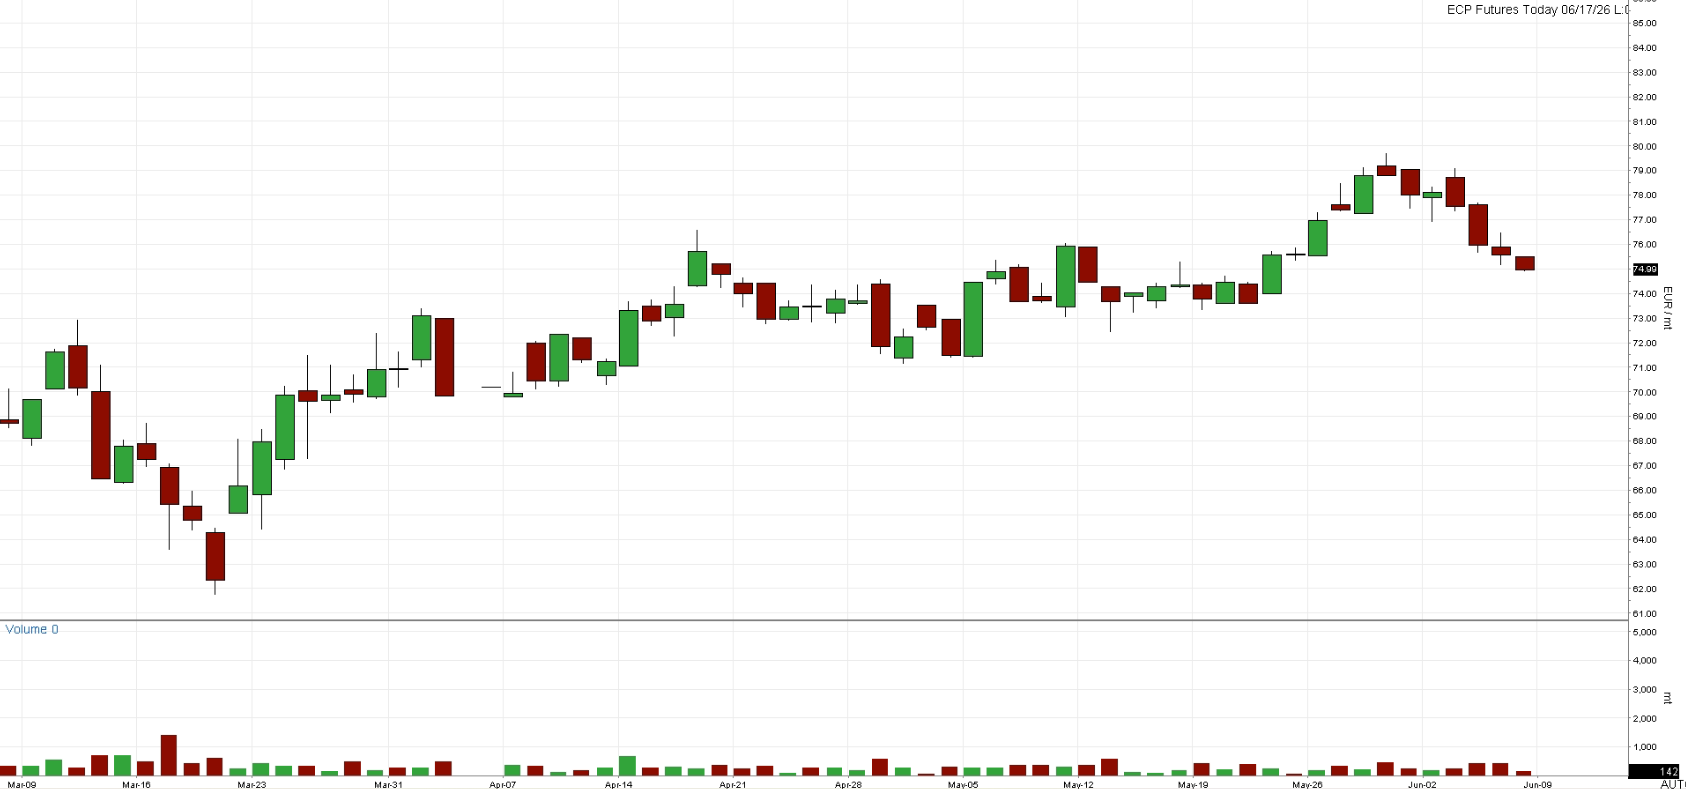
Chart A: EUA Spot (Futures Today) Price (EUR)
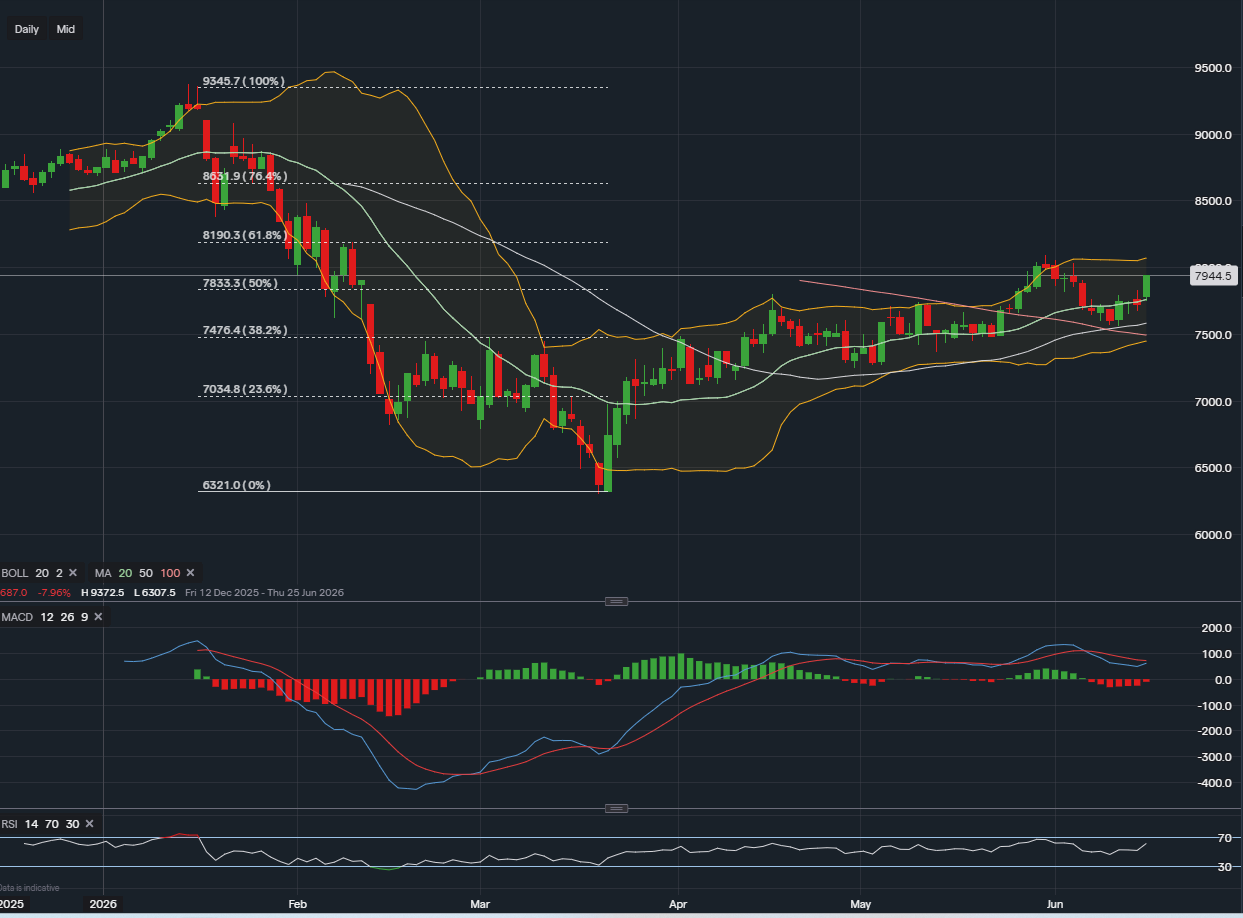
Technically, EUAs have aggressively resumed their upward trajectory, with the Dec-26 contract staging a powerful rebound to trade around the EUR 79.45 level. This bullish resurgence has completely neutralized the recent corrective pullback, with the latest marquee green candle decisively reclaiming both the 100-day moving average and the critical 50% Fibonacci retracement level to re-establish a dominant topside bias.
The EUR 78.33 level, which briefly capped the market during the prior consolidation, has been cleanly pierced and has flipped back into immediate structural support alongside the EUR 77.81 zone. Momentum indicators reflect this sudden influx of aggressive buying pressure; the MACD lines are stabilizing well above the zero line with the bearish histogram bars rapidly contracting toward a bullish re-cross, while the RSI has hooked sharply upward to 62, signaling robust buyer re-entry with ample capacity for further expansion before encountering overbought exhaustion.
From a purely technical perspective, the market is expanding back toward the upper Bollinger Band, positioning itself for an imminent retest of the psychological EUR 80.00 threshold. A sustained daily close above this level opens a direct path toward the next major liquidity cluster at the 61.8% Fibonacci retracement level near EUR 81.90. Conversely, any localized intraday pullbacks are expected to find firm baseline insulation within the newly re-established EUR 77.81 to EUR 78.33 support zone.
Chart B: December 2026 EUA Price (EUR) - Technical
AFS ENERGY B.V.
The information contained in the AFS Energy EU ETS Report, hereinafter Report, has been compiled or arrived from sources believed to be reliable but no representation or warranty, express or implied, is made as to their accuracy, completeness, timeliness, correct sequencing or correctness.
AFS Energy B.V. does not accept any liability, contingent otherwise for (i) the accuracy, completeness, timeliness or correctness of any information provided in the Report, (ii) any decision made, or action taken by you in reliance upon any of them and (iii) any direct or consequential loss arising from the use of the Report. AFS Energy B.V. does not make any representation or warranty about the suitability of the information in the Report.
The information contained in the Report is published for the assistance of the recipient but is not to be relied upon as authoritative or taken in substitution for the exercise of judgement by any recipient.


