We collaborate to achieve sustainable success
A leading environmental solution provider
Get in touch with usAFS Energy EU ETS Market Report - Week 21 2026

Do you want to receive to-the-minute up to date info? Please sign up to our client portal and/or to the Viridian Exchange.
Auction volume: 9.23 million EUAs, 2.28 more than last week.
Energy Fundamentals
The fundamental backdrop for EUAs remains relatively constructive, with geopolitical tensions and strengthening energy markets continuing to provide underlying support. European gas storage has improved further to 36.3%, which slightly eases immediate supply concerns, but ongoing uncertainty surrounding Iran and broader Middle East tensions continues to keep risk premia elevated across both gas and oil markets. Oil prices moved to a two-week high following the drone attack on a UAE nuclear facility, while European natural gas also strengthened as negotiations between the US and Iran showed little progress. These developments reinforce concerns about supply disruptions and higher energy costs heading into the second half of the year. Historically, stronger gas and power prices tend to support EUA demand expectations, particularly when utilities increase hedging activity or coal generation becomes relatively more attractive.
On the policy side, the market remains focused on potential EU intervention measures. Brussels is reportedly considering both fertiliser stockpiles and limited ETS relief mechanisms to soften the economic impact of higher energy prices. While this introduces some short-term uncertainty for carbon pricing, broader expectations still point toward tighter EUA balances later in 2026 rather than structural weakening of the system. This is reflected in analyst expectations that EU carbon prices may remain relatively stable near term despite geopolitical volatility. At the same time, investment flows into carbon credits continue to strengthen, with record levels of capital entering the market as buyers increasingly position for longer-term scarcity and decarbonisation trends. Combined with continued geopolitical instability surrounding Russia and Ukraine, the broader environment still leans mildly supportive for EUA prices overall. While policy discussions around temporary relief measures could cap upside momentum in the short term, the underlying structural outlook for the carbon market remains constructive.
- Gas storage currently sits at 36.3% (May 16th, 2026)
- Oil Touches Two-Week High After Drone Attack On UAE Nuclear Power Plant
- European Natural Gas Climbs As US And Iran Remain Far From Deal
- EU Carbon Prices To Hold Steady Despite Geopolitical Risks, Tighter Balances Seen Later In 2026
- Brussels Weighs Fertiliser Stockpiles, ETS Relief As Middle East Conflict Drives Price Shock
- Investment In Carbon Credits Hits Record High As Buyers Shift Focus
- Putin faces 'very difficult choices' in Ukraine as sanctions bite, Estonia's spy chief says
Investment Funds
- Investment funds decreased their net long position to +40.7m EUAs on May 8th (vs. +34.98 EUAs on May 1st).
- Gross short positions decreased to -22.18m EUAs (vs. -27.53m EUAs).
- Gross long positions stayed almost the same at 62.88 mln EUAs (vs. 62.51m EUAs).
Market Prices
- Indicative Dec26 EUA Price: €
- Indicative Spot EUA Price: €
- YTD Spot EUA Price: €75.20
- MTD Spot EUA Price: €73.98
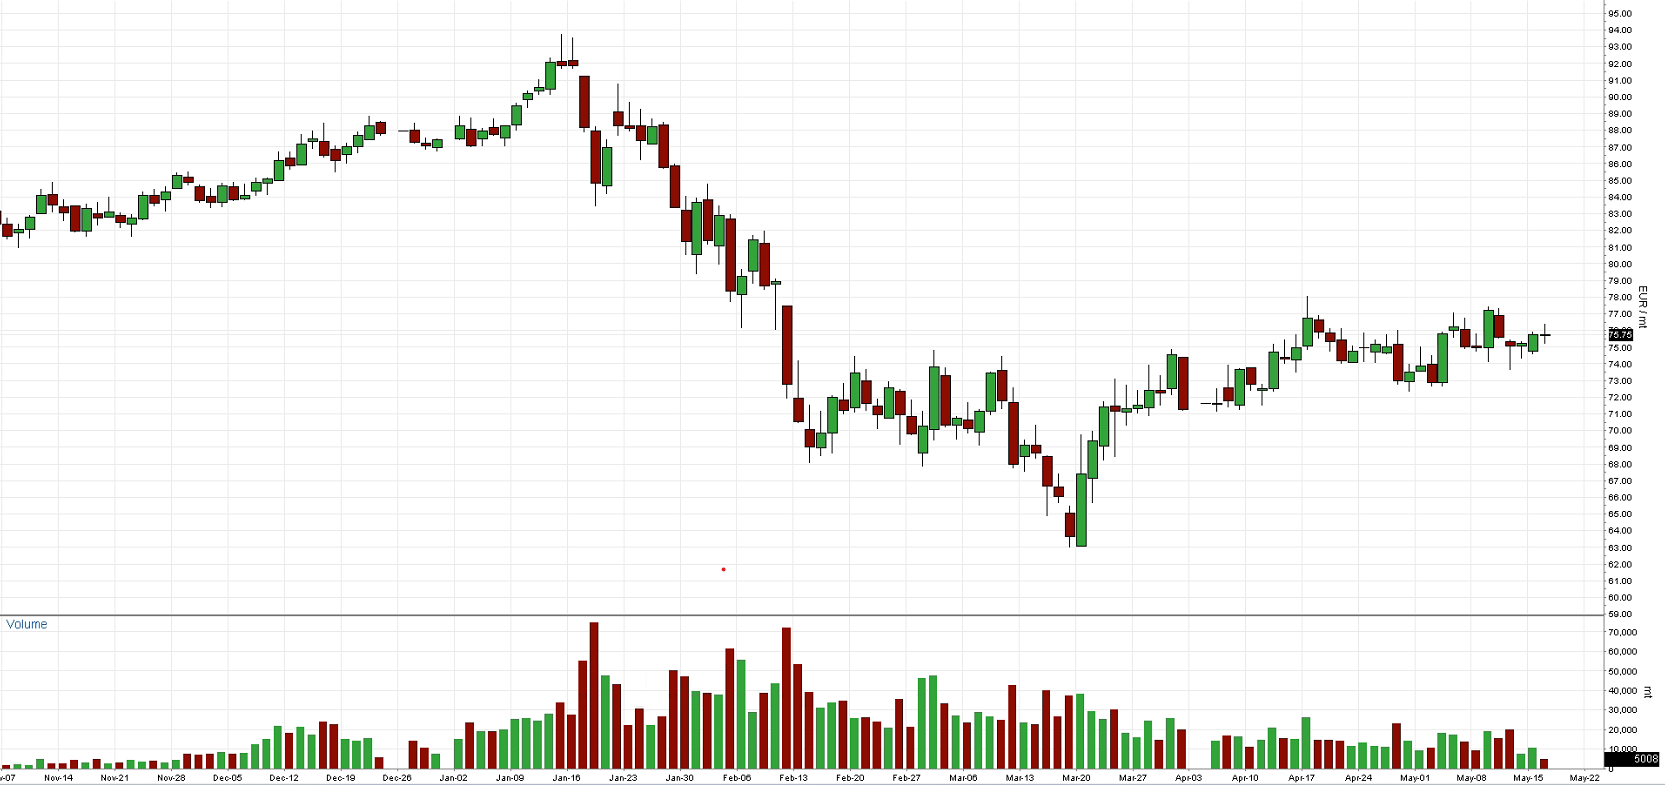
Chart A: December 2026 EUA Price (EUR)
Technical Analysis
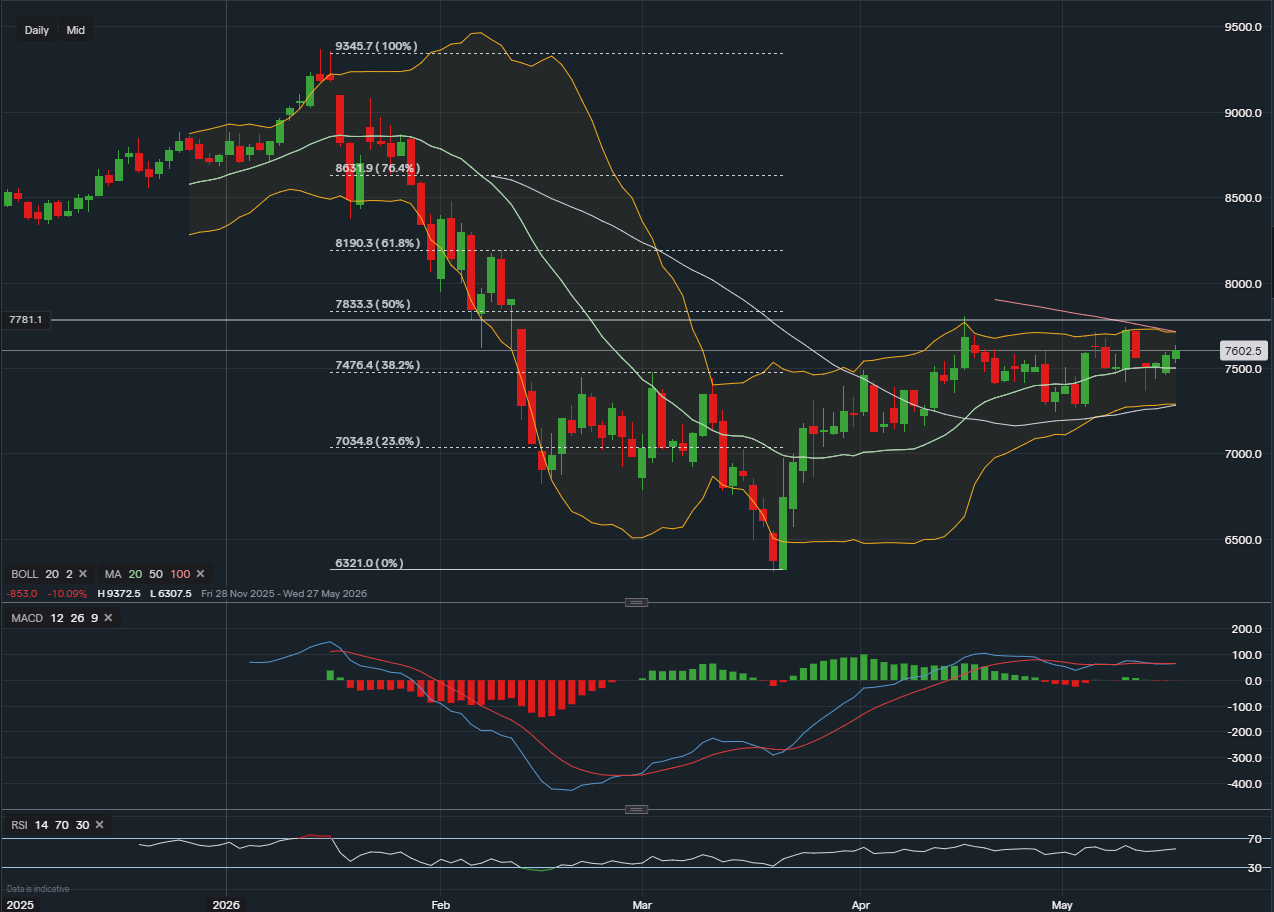
Technically, EUAs have broken to the upside of their recent consolidation, with the Dec-26 contract cleanly clearing previous congestion to trade around the EUR 76.03 level. This topside breakout follows a definitive violation of the descending trendline that capped the market during early May, signaling a structural shift toward a more constructive short-term bias.
The EUR 74.76 level, which previously served as a major overhead barrier aligned with the 38.2% Fibonacci retracement, has now transitioned into immediate structural support. Momentum indicators confirm this renewed strength; the MACD histogram has successfully turned back into positive territory with expanding bullish bars, while the RSI has moved up to 58, indicating solid buyer control with ample running room before encountering overbought conditions.
From a purely technical perspective, the market is currently expanding along the upper Bollinger Band, drawing a direct path toward the next major liquidity cluster. The primary upside target remains the heavy resistance zone between EUR 77.81 and EUR 78.33, where the 100-day moving average converges with the 50% Fibonacci retracement level. Conversely, any brief profit-taking pullbacks are expected to find firm baseline demand near the newly established EUR 74.76 support pivot.
Chart B: December 2026 EUA Price (EUR) - Technical
AFS ENERGY B.V.
The information contained in the AFS Energy EU ETS Report, hereinafter Report, has been compiled or arrived from sources believed to be reliable but no representation or warranty, express or implied, is made as to their accuracy, completeness, timeliness, correct sequencing or correctness.
AFS Energy B.V. does not accept any liability, contingent otherwise for (i) the accuracy, completeness, timeliness or correctness of any information provided in the Report, (ii) any decision made, or action taken by you in reliance upon any of them and (iii) any direct or consequential loss arising from the use of the Report. AFS Energy B.V. does not make any representation or warranty about the suitability of the information in the Report.
The information contained in the Report is published for the assistance of the recipient but is not to be relied upon as authoritative or taken in substitution for the exercise of judgement by any recipient.

