We collaborate to achieve sustainable success
A leading environmental solution provider
Get in touch with usAFS Energy EU ETS Market Report - Week 19 2026

Do you want to receive to-the-minute up to date info? Please sign up to our client portal and/or to the Viridian Exchange.
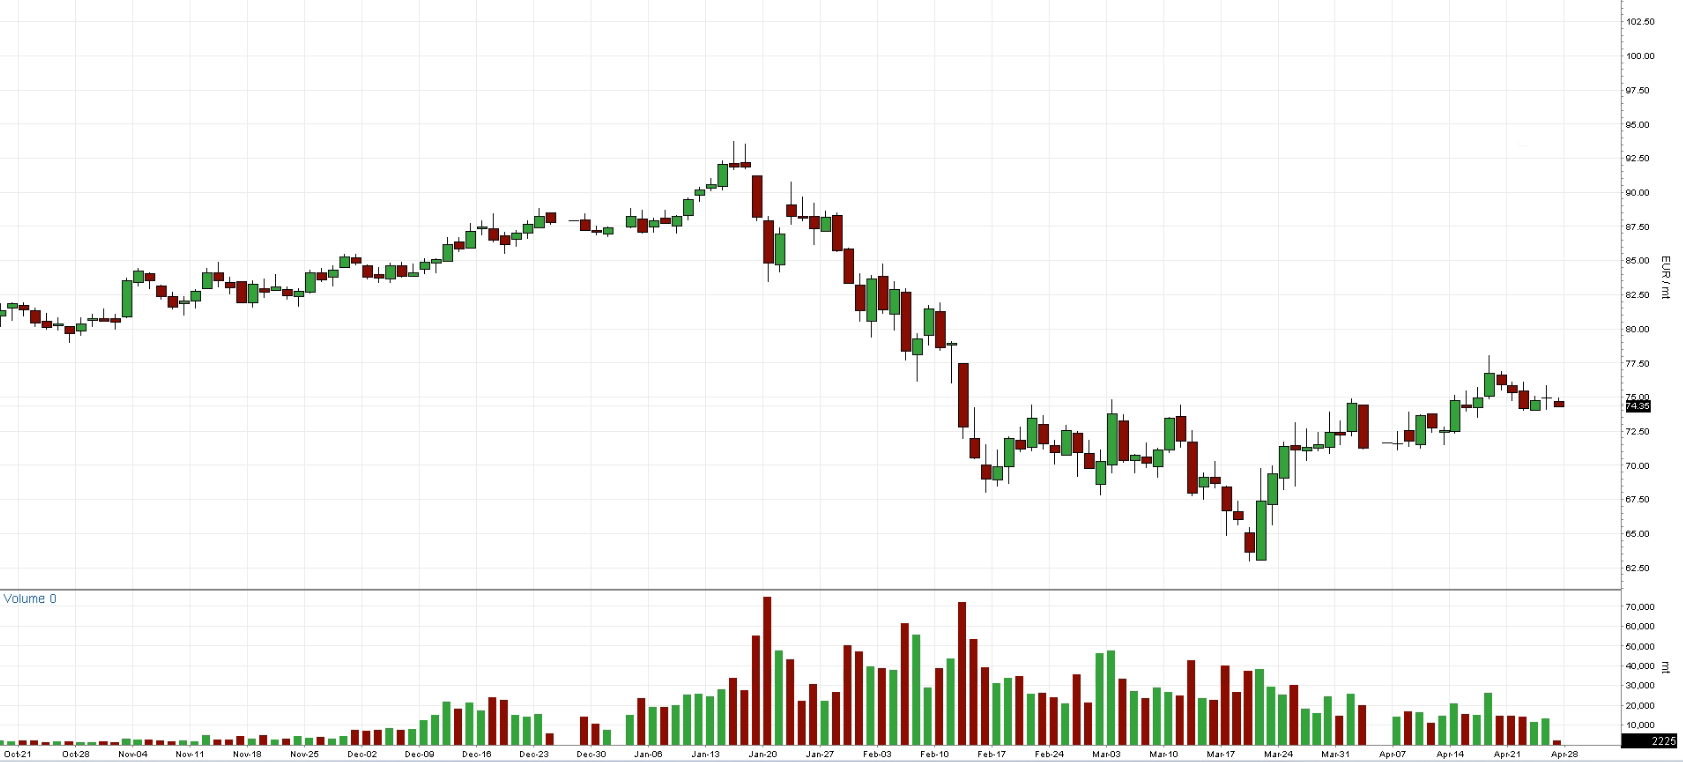
Last week, EUAs decreased for 1.8% from Monday’s open (73.22) to Friday’s close (72.65); weekly high (74.60) / low (71.18) spread was €3.42
Auction volume: 9.23 million EUAs, 0.43 less than last week.
Energy Fundamentals
The fundamental backdrop remains mixed but with a slight supportive undertone for EUA prices heading into the coming period. Gas storage has risen to 33.4%, which helps ease immediate supply concerns and could reduce short-term urgency for aggressive gas buying. However, structurally, storage levels are still not particularly high for this stage, meaning the market remains sensitive to any supply disruptions or renewed demand spikes.
On the policy side, discussions around the EU ETS continue to introduce uncertainty. Calls from the chemical industry for a potential “force majeure” clause, alongside ongoing debates about carbon pricing in global shipping under the Net-Zero Framework, suggest that regulatory pressure could soften at the margin. This creates a mild bearish undertone for EUA prices, as any flexibility or delay mechanisms typically reduce compliance urgency and demand for allowances.
Geopolitically, tensions remain elevated. Frictions between Europe, the US, and Russia, combined with ongoing uncertainty around Iran and potential peace negotiations, keep energy markets on edge. The broader narrative of Europe fearing a geopolitical “window of opportunity” and continued NATO-related tensions reinforces the risk premium in energy markets. This tends to indirectly support EUA prices, as higher fossil fuel prices (particularly gas and oil) can sustain demand for coal switching and emissions hedging.
Overall, the balance of factors points to a slightly supportive but uncertain outlook. While rising storage and potential ETS flexibility could cap upside, persistent geopolitical risks and structural energy market tightness continue to provide a floor. The result is likely a more range-bound environment, where EUA prices remain sensitive to both policy developments and geopolitical headlines rather than trending decisively in one direction.
- Gas storage currently sits at 33.4% (May 2nd, 2026)
- EU ETS needs ‘force majeure’ clause, says chemical industry
- Global shipping carbon price still on the table as countries agree to continue talks on Net-Zero Framework
- Europe fears Putin’s ‘window of opportunity’ is now
- Merz shrugs off Trump clash over troops, trade
- EU trade chief to meet with Trump’s top trade official as tensions spike
- NATO's Rutte says Europeans have 'gotten message' from Trump
- Iran confirms US peace proposal being ‘reviewed’
Investment Funds
- Investment funds decreased their net long position to +37.9m EUAs on April 24th (vs. +41.44 EUAs on April 17th).
- Gross short positions increased to -30m EUAs (vs. -27.57m EUAs).
- Gross long positions slightly decreased to 67.9 mln EUAs (vs. 68.99m EUAs).
Market Prices
- Indicative Dec26 EUA Price: €73.34
- Indicative Spot EUA Price: €72.04
- YTD Spot EUA Price: €75.33
- MTD Spot EUA Price: €72.78
Chart A: December 2026 EUA Price (EUR)
Technical Analysis
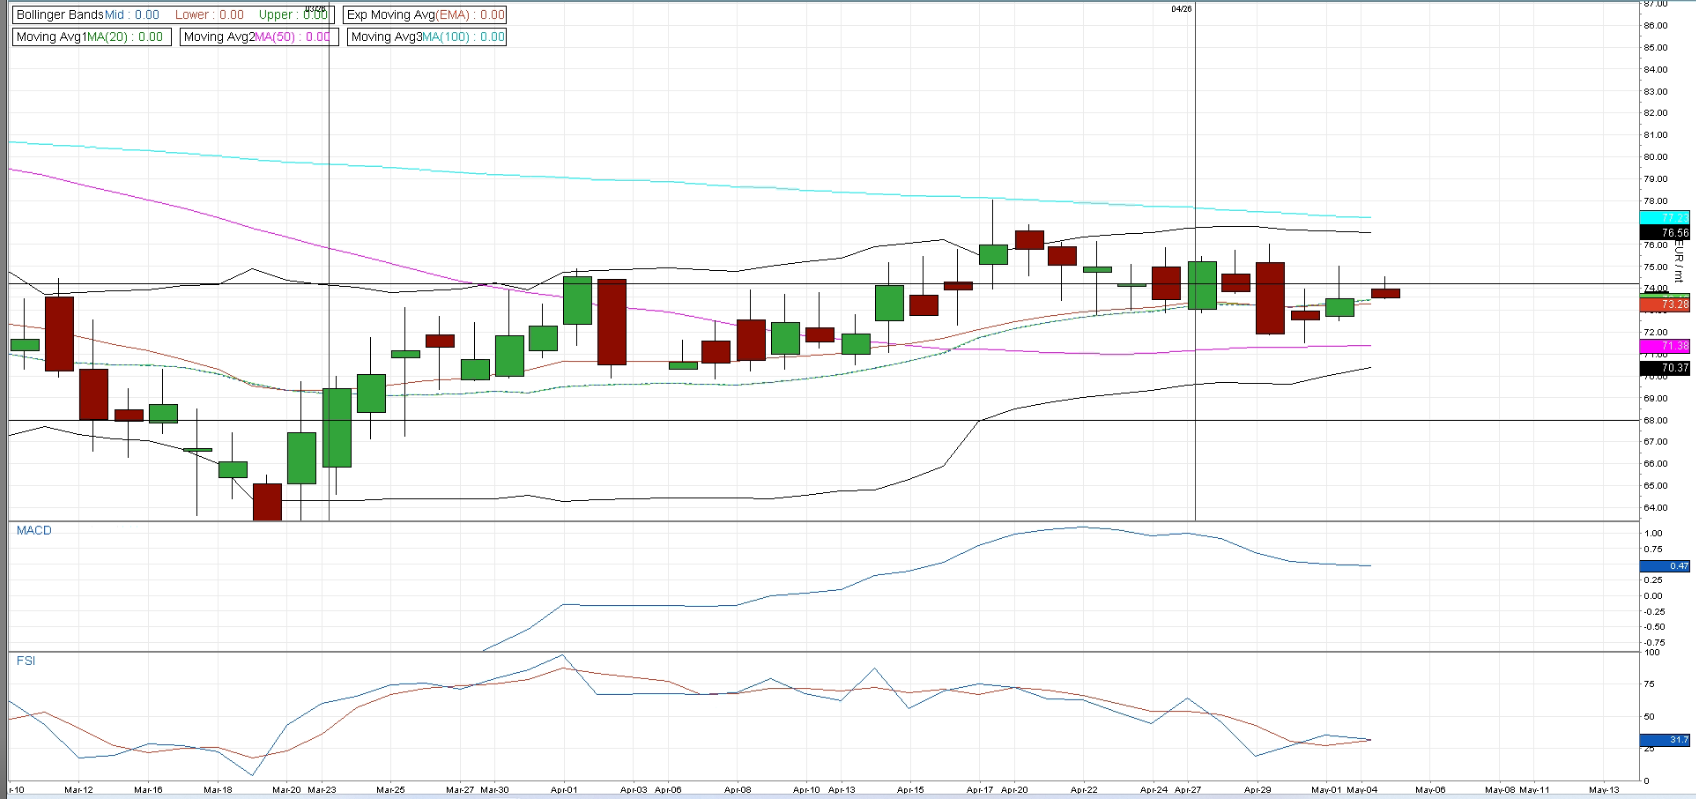
From a technical standpoint, the DEC26 EUA contract remains broadly neutral. The 74.80 level continues to act as a significant resistance, having served as strong support only a few days ago. Analysis of the Bollinger Bands indicates that EUAs are trading within a relatively narrow range between €76.60 and €70.37.
The current price is positioned near the middle Bollinger Band, which also coincides with the EMA, representing the first key barrier to further downside movement. Should the price break below this level, the next support levels are expected around €71.40 and €70.40, respectively.
In terms of technical indicators, both MACD and RSI suggest a modest bearish bias; however, neither signals the likelihood of a more pronounced price movement at this stage. Additionally, trading volumes remain lower compared to the first quarter, implying that a significant market catalyst or headline event would likely be required to drive increased activity and generate momentum for a larger price swing.
With that said, it is expected that EUA stays in the 71-76EUR range until some bigger headline doesn’t decide the direction.
Chart B: December 2026 EUA Price (EUR) - Technical
AFS ENERGY B.V.
The information contained in the AFS Energy EU ETS Report, hereinafter Report, has been compiled or arrived from sources believed to be reliable but no representation or warranty, express or implied, is made as to their accuracy, completeness, timeliness, correct sequencing or correctness.
AFS Energy B.V. does not accept any liability, contingent otherwise for (i) the accuracy, completeness, timeliness or correctness of any information provided in the Report, (ii) any decision made, or action taken by you in reliance upon any of them and (iii) any direct or consequential loss arising from the use of the Report. AFS Energy B.V. does not make any representation or warranty about the suitability of the information in the Report.
The information contained in the Report is published for the assistance of the recipient but is not to be relied upon as authoritative or taken in substitution for the exercise of judgement by any recipient.

