

A leading environmental solution provider
Get in touch with usThe outlook for EUA prices this week is shaped by a continued tension between supportive geopolitical risk in energy markets and increasingly mixed underlying demand signals. European gas storage has risen to 31.5% as of late April, marking a gradual improvement but still leaving inventories below comfortable levels for this stage of the injection season. This keeps the market sensitive to supply-side disruptions, particularly as uncertainty around key transit routes persists.
Geopolitical developments remain the dominant driver. Iran’s proposal to reopen the Strait of Hormuz and ongoing diplomatic engagement with Russia suggest a potential de-escalation pathway, but negotiations remain fragile, with US–Iran peace talks stalling and oil prices rising modestly in response. At the same time, continued disruptions and risk premia in tanker markets, alongside a steady increase in LNG vessel orders despite the uncertain outlook, reinforce expectations of structurally tight global gas and oil balances. These dynamics continue to provide indirect support to EUA prices through higher fuel-switching incentives in the power sector.
However, broader signals remain more mixed. A rare late-April Arctic cold air intrusion across Eastern and Southeastern Europe is expected to temporarily lift heating demand, offering short-term support to gas and power prices, but this effect is likely transient and does not materially alter the underlying seasonal trajectory. Meanwhile, the acceleration of LNG infrastructure investment contrasts with the uncertain geopolitical backdrop, highlighting a market that is positioning for long-term demand resilience despite near-term volatility.
Chart A: December 2026 EUA Price (EUR)
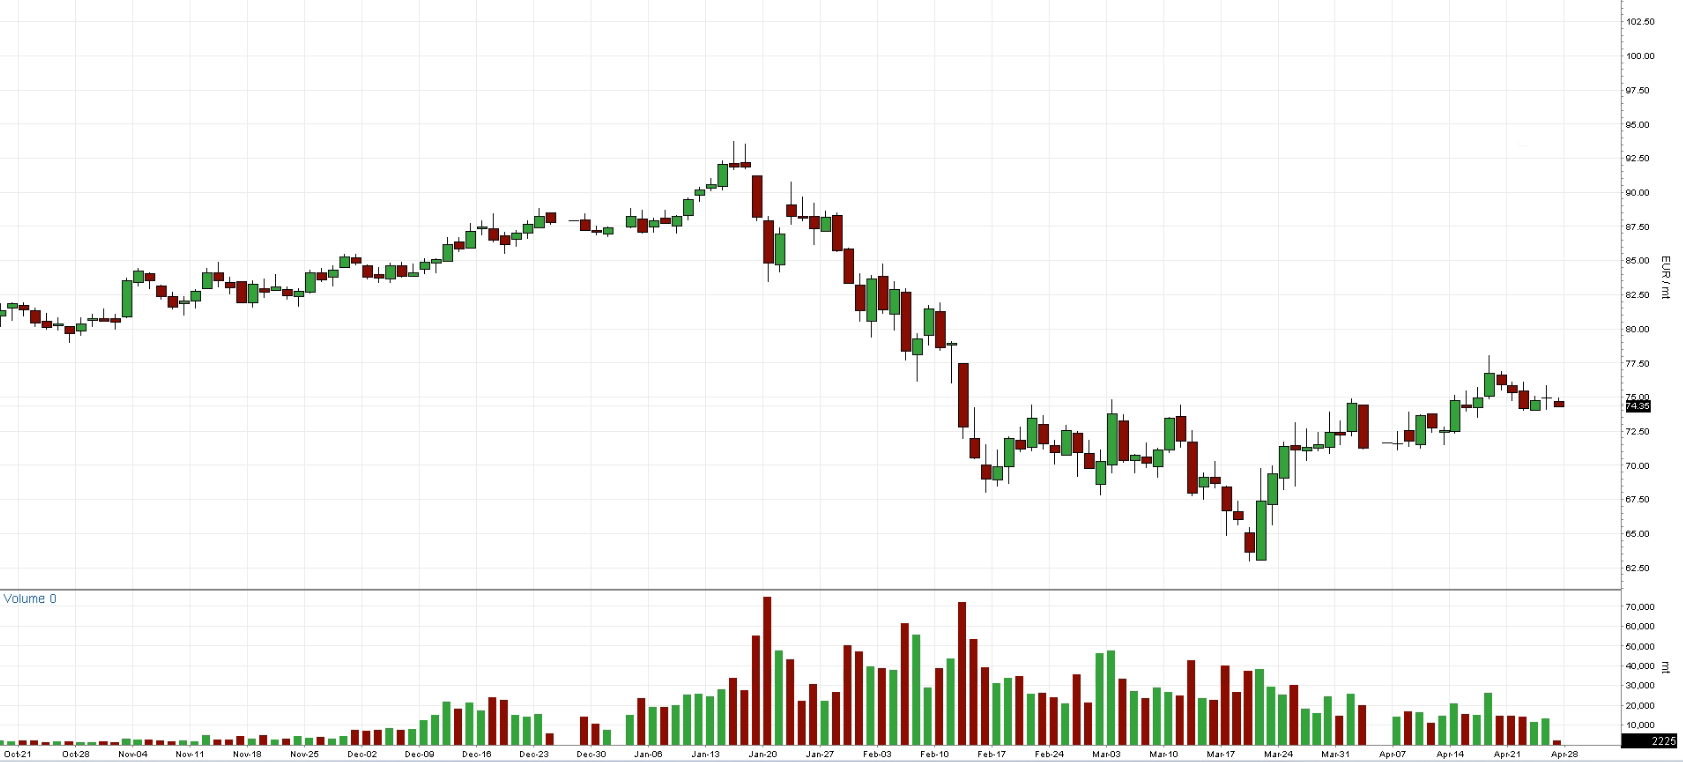
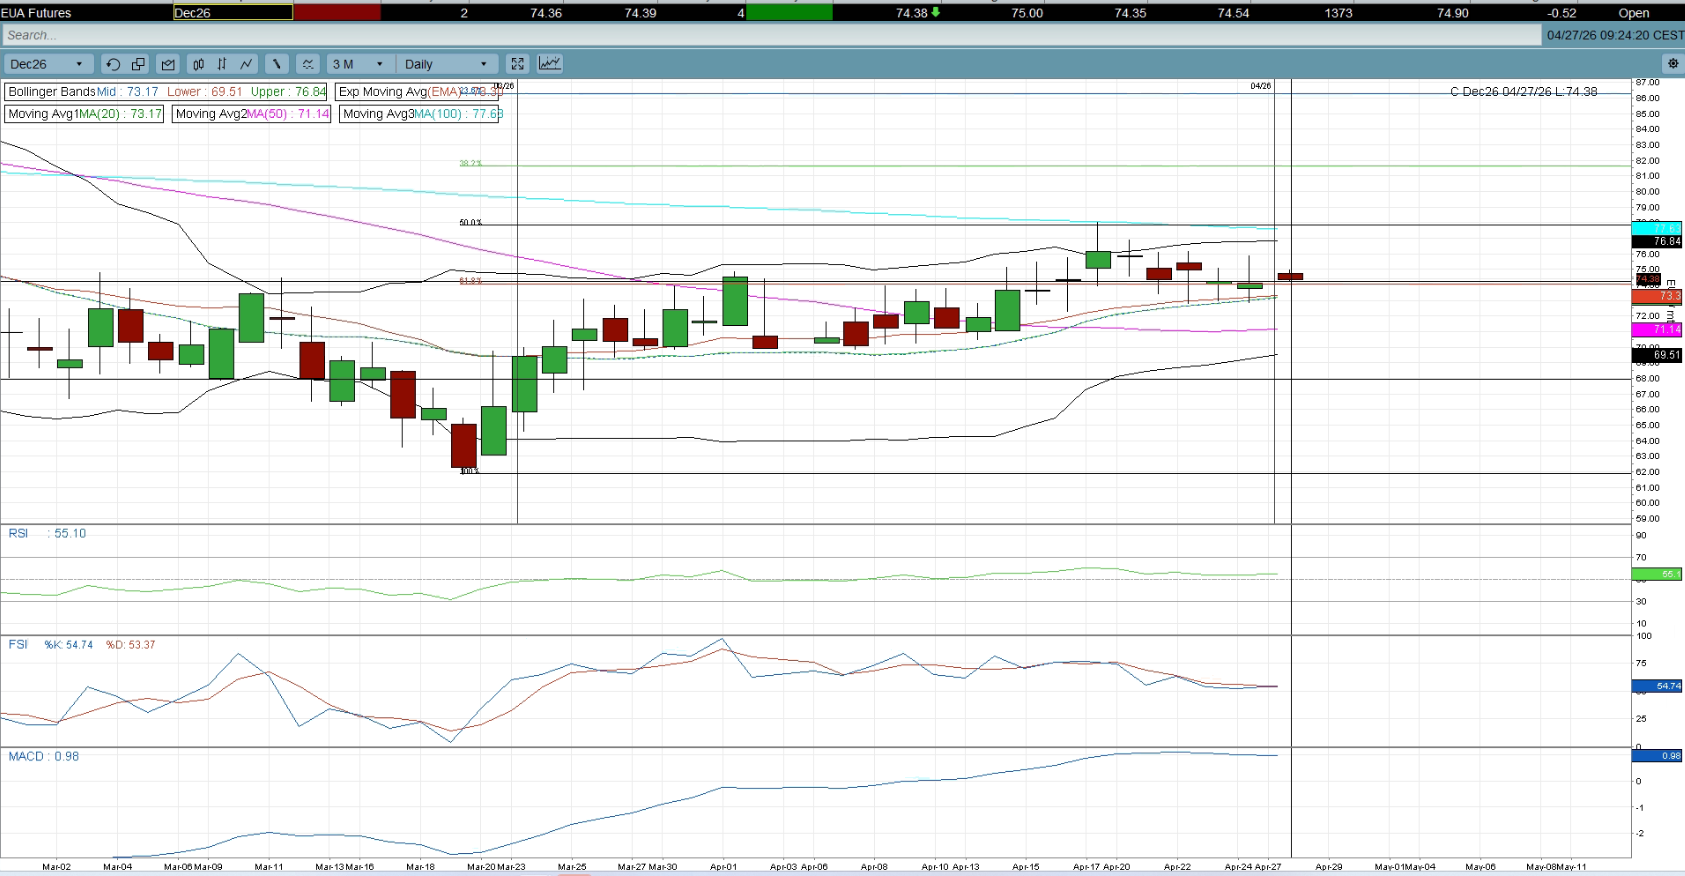
The technical outlook for this week indicates that the 74.20 level on the December 2026 contract, previously acting as resistance two weeks ago, has now transitioned into a support level. EUAs are currently struggling to break above this threshold, which also coincides with the 61% Fibonacci retracement level.
Should the price move out of its current consolidation range, the next upside targets are 76.84, followed by 77.62, aligning with the 100-day moving average and the 50% Fibonacci retracement level.
On the downside, a break below 74.00 EUR would expose initial support at approximately 73.30, a level reinforced by both the exponential moving average and the middle Bollinger Band. A sustained move below this point could open the way toward the mid-71 EUR range.
Technical indicators present a mixed but slightly bearish bias. Both MACD and FSI suggest potential downward pressure, though not of a particularly strong magnitude. Meanwhile, the RSI remains neutral, indicating a lack of clear directional momentum.
Overall, the market is likely to remain range-bound between 70 and 75 EUR in the near term, unless new fundamental developments emerge to drive a decisive breakout.
Chart B: December 2026 EUA Price (EUR) - Technical
AFS ENERGY B.V.
The information contained in the AFS Energy EU ETS Report, hereinafter Report, has been compiled or arrived from sources believed to be reliable but no representation or warranty, express or implied, is made as to their accuracy, completeness, timeliness, correct sequencing or correctness.
AFS Energy B.V. does not accept any liability, contingent otherwise for (i) the accuracy, completeness, timeliness or correctness of any information provided in the Report, (ii) any decision made, or action taken by you in reliance upon any of them and (iii) any direct or consequential loss arising from the use of the Report. AFS Energy B.V. does not make any representation or warranty about the suitability of the information in the Report.
The information contained in the Report is published for the assistance of the recipient but is not to be relied upon as authoritative or taken in substitution for the exercise of judgement by any recipient.


