We collaborate to achieve sustainable success
A leading environmental solution provider
Get in touch with usAFS Energy EU ETS Market Report - Week 17 2026

Do you want to receive to-the-minute up to date info? Please sign up to our client portal and/or to the Viridian Exchange.
Energy Fundamentals
The outlook for EUA prices this week is shaped by a continued divergence between supportive energy markets and softer structural demand signals. European gas storage has risen to 30.2%, which is a modest improvement but still relatively low for this stage of the injection season. This keeps underlying concerns intact around the ability to sufficiently refill inventories ahead of winter, particularly if elevated prices continue to discourage storage injections. Geopolitical tensions remain the dominant driver. The escalating standoff between the US and Iran, including tanker disruptions in the Strait of Hormuz and retaliatory threats from Tehran, have pushed oil prices higher again. This sustained strength in energy markets supports EUA prices indirectly, as higher gas and oil prices increase the likelihood of coal switching in the power sector, thereby lifting carbon demand. Forward expectations that US fuel prices may remain elevated until 2027 further reinforce the idea of structurally tighter energy markets. At the same time, structural signals within the carbon market remain more bearish. Verified EU ETS emissions declined by 1.3% in 2025, confirming a gradual reduction in underlying demand for allowances. In addition, global energy demand growth is increasingly being met by renewables, particularly solar, which structurally reduces future carbon intensity and caps long-term EUA demand growth. Policy developments add another layer of uncertainty. The US push within the IMO for a mandatory phaseout of the EU ETS introduces potential longer-term risks to the scope of the system, although near-term impact remains limited. Meanwhile, ongoing geopolitical negotiations and EU-level fiscal discussions, such as potential funding agreements linked to energy flows, highlight how closely energy, politics, and carbon markets remain intertwined.
Overall, EUA prices may stay supported in the near term by strong energy markets and geopolitical risk, but structural demand softness and policy uncertainty could limit upside. This leaves the market with a balanced outlook, leaning mildly bullish as long as energy prices remain elevated.
- Gas storage currently sits at 30.2% (April 18th, 2026)
- Total emissions covered by the EU ETS fell by 1.3% in 2025 compared to 2024
- Oil prices rise anew after a US-Iran standoff in the Strait of Hormuz strands tankers
- Trump energy secretary says gas prices might not drop back under $3 a gallon until 2027
- Global energy demand growth was met by diverse range of sources in 2025, led by solar and then gas
- US Calls for Mandatory Phaseout of EU ETS in Formal IMO Submission
- Tehran vows retaliation after US seizes Iran-flagged vessel defying blockade
- Iran Rejects New Peace Talks as Trump Sends Negotiators to Pakistan
- Orbán signals readiness to approve €90B EU loan to Ukraine once Druzhba oil is flowing
Investment Funds
- Investment funds slightly increased their net long position to +34.72m EUAs on April 10th (vs. +32.84 EUAs on April 2nd).
- Gross short positions decreased to -36.17 EUAs (vs. -37.67m EUAs).
- Gross long positions slightly increased to 70.89 mln EUAs (vs. 70.5m EUAs).
Market Prices
- Indicative Dec26 EUA Price: €75.91
- Indicative Spot EUA Price: €74.56
- YTD Spot EUA Price: €75.598
- MTD Spot EUA Price: €72.26
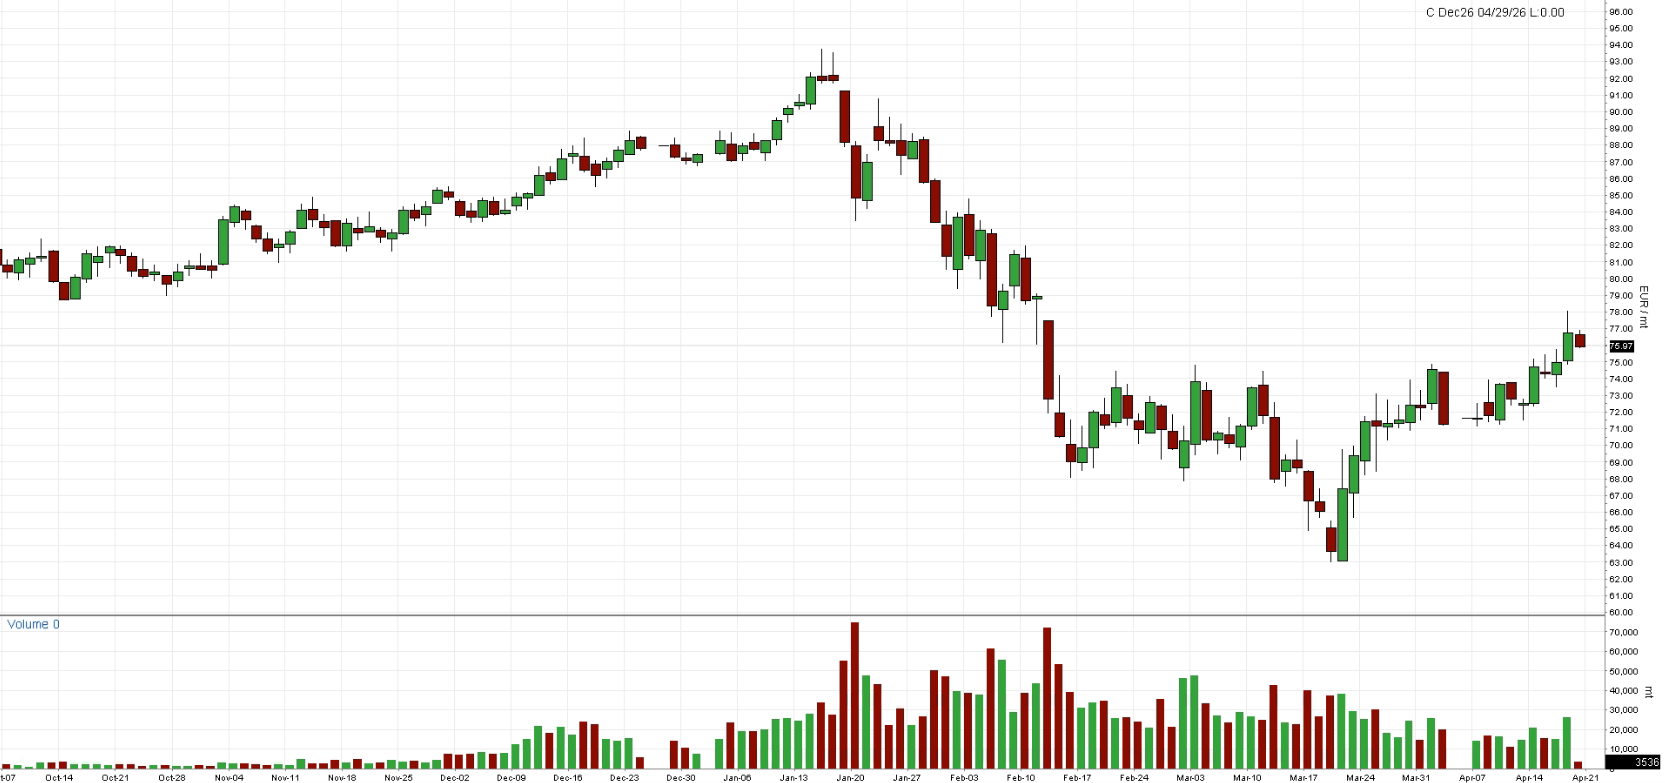
Chart A: December 2026 EUA Price (EUR)
Technical Analysis
Dec26 price action continues to recover from the €62–64 lows, with the market now pushing into the €76–78. This suggests that short-term structure has shifted from bearish to constructive, the market is now exceeding a key resistance zone where previous breakdowns occurred. The Bollinger Bands are beginning to expand again after a period of contraction, reflecting renewed volatility to the upside. Price is trading near or over the upper band, which typically signals strengthening momentum. However, this also increases the likelihood of short-term consolidation if the market struggles to consistently break through nearby resistance levels. Moving averages are gradually turning supportive. The 20-day MA has clearly turned higher and is now acting as dynamic support, with price consistently holding above it. The 50-day MA (€72–73) has been reclaimed and is also starting to flatten, while the 100-day MA (~€78) remains above current price levels and for now continues to define the broader bearish structure. The cluster between €77–80, where the 100-day MA approaches, represents a key resistance zone. Momentum indicators are supportive. RSI is holding above 50 and trending higher, indicating improving strength without yet being overbought. CCI has moved firmly into positive territory, reflecting strong short-term momentum. MACD has crossed into positive territory and continues to rise, confirming that bullish momentum is building following the earlier sell-off.
The technical picture has improved to a short-term bullish bias, supported by rising momentum and reclaiming of key moving averages. However, the market is now approaching a significant resistance zone around €78–80. A clean break above this area would open the door for a broader recovery, while failure to do so could lead to consolidation or a pullback. Overall, momentum favors the upside, but confirmation is needed at resistance to validate continuation.
Chart B: December 2026 EUA Price (EUR) - Technical

AFS ENERGY B.V.
The information contained in the AFS Energy EU ETS Report, hereinafter Report, has been compiled or arrived from sources believed to be reliable but no representation or warranty, express or implied, is made as to their accuracy, completeness, timeliness, correct sequencing or correctness.
AFS Energy B.V. does not accept any liability, contingent otherwise for (i) the accuracy, completeness, timeliness or correctness of any information provided in the Report, (ii) any decision made, or action taken by you in reliance upon any of them and (iii) any direct or consequential loss arising from the use of the Report. AFS Energy B.V. does not make any representation or warranty about the suitability of the information in the Report.
The information contained in the Report is published for the assistance of the recipient but is not to be relied upon as authoritative or taken in substitution for the exercise of judgement by any recipient.

