We collaborate to achieve sustainable success
A leading environmental solution provider
Get in touch with usAFS Energy EU ETS Market Report - Week 16 2026

Do you want to receive to-the-minute up to date info? Please sign up to our client portal and/or to the Viridian Exchange.
Energy Fundamentals
The Fundamental outlook for EUA prices this week is shaped by a mix of softer structural signals and renewed geopolitical support. European gas storage has edged up slightly to 29.3%, and the Gas Coordination Group has signaled that the EU is relatively well-prepared for the summer season looking at the current geopolitical situation. Together with the confirmation that EU ETS emissions fell by 1.3% in 2025, this points to structurally weaker demand for allowances, which may act as a mild bearish factor for EUA prices in the near term. However, the macro and geopolitical backdrop is turning more supportive. Rising tensions around Iran, including potential US action to blockade Iranian ports, have pushed oil prices back above $100, adding a renewed risk premium to energy markets. Higher energy prices, particularly in gas and oil, can indirectly support EUA demand by increasing the likelihood of coal switching in power generation, which raises carbon emissions. At the same time, broader market sentiment remains fragile. The strengthening US dollar, driven by failing peace talks, may add pressure to commodities more broadly, but the dominant driver for EUAs remains energy market dynamics. Russia’s indication that it could supply gas to the EU in case of surplus introduces a potential downside risk to gas prices, which could in turn limit upside in carbon if realized.
Overall, the near-term outlook for EUA prices appears balanced. Structural factors such as lower emissions and adequate storage lean slightly bearish, but geopolitical tensions and firmer energy prices provide a supportive counterweight, keeping the market biased toward volatility with a slight upward tilt if energy markets remain elevated.
- Gas storage currently sits at 29.3% (April 11th, 2026)
- Total emissions covered by the EU ETS fell by 1.3% in 2025 compared to 2024
- US to blockade Iran ports after talks fail to yield a deal
- Russia ready to supply gas to the EU if it has a surplus
- Gas Coordination Group confirms EU preparedness for the upcoming summer season
- Oil up over 7% to above $100
- EU ETS verified emissions fell 1.3% in 2025, European Commission says
- Dollar gains as peace talks falter
- European Gas Prices Jump as US Set to Blockade Iran Ports
- EU Emissions Trading System Sustains Downward Trend in Emissions
Investment Funds
- Investment funds slightly increased their net long position to +32.84m EUAs on April 2nd (vs. +32.36 EUAs on March 27th).
- Gross short positions decreased to -37.67 EUAs (vs -41.89m EUAs).
- Gross long positions decreased to 70.5 mln EUAs (vs. 74.25m EUAs).
Market Prices
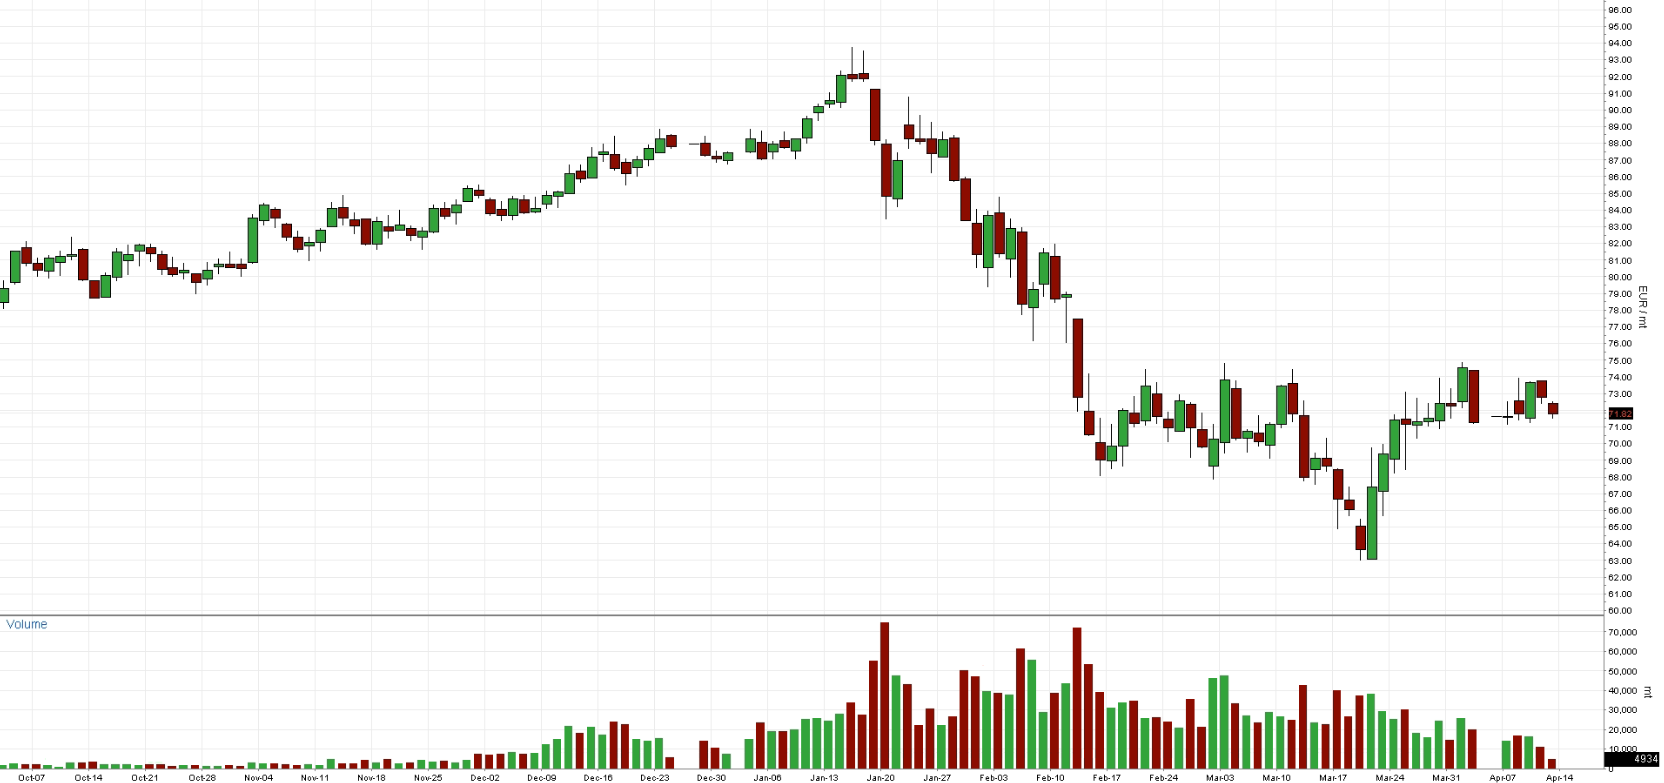
- Indicative Dec26 EUA Price: €72.64
- Indicative Spot EUA Price: €71.26
- YTD Spot EUA Price: €75.75
- MTD Spot EUA Price: €71.27
Chart A: December 2026 EUA Price (EUR)
Technical Analysis
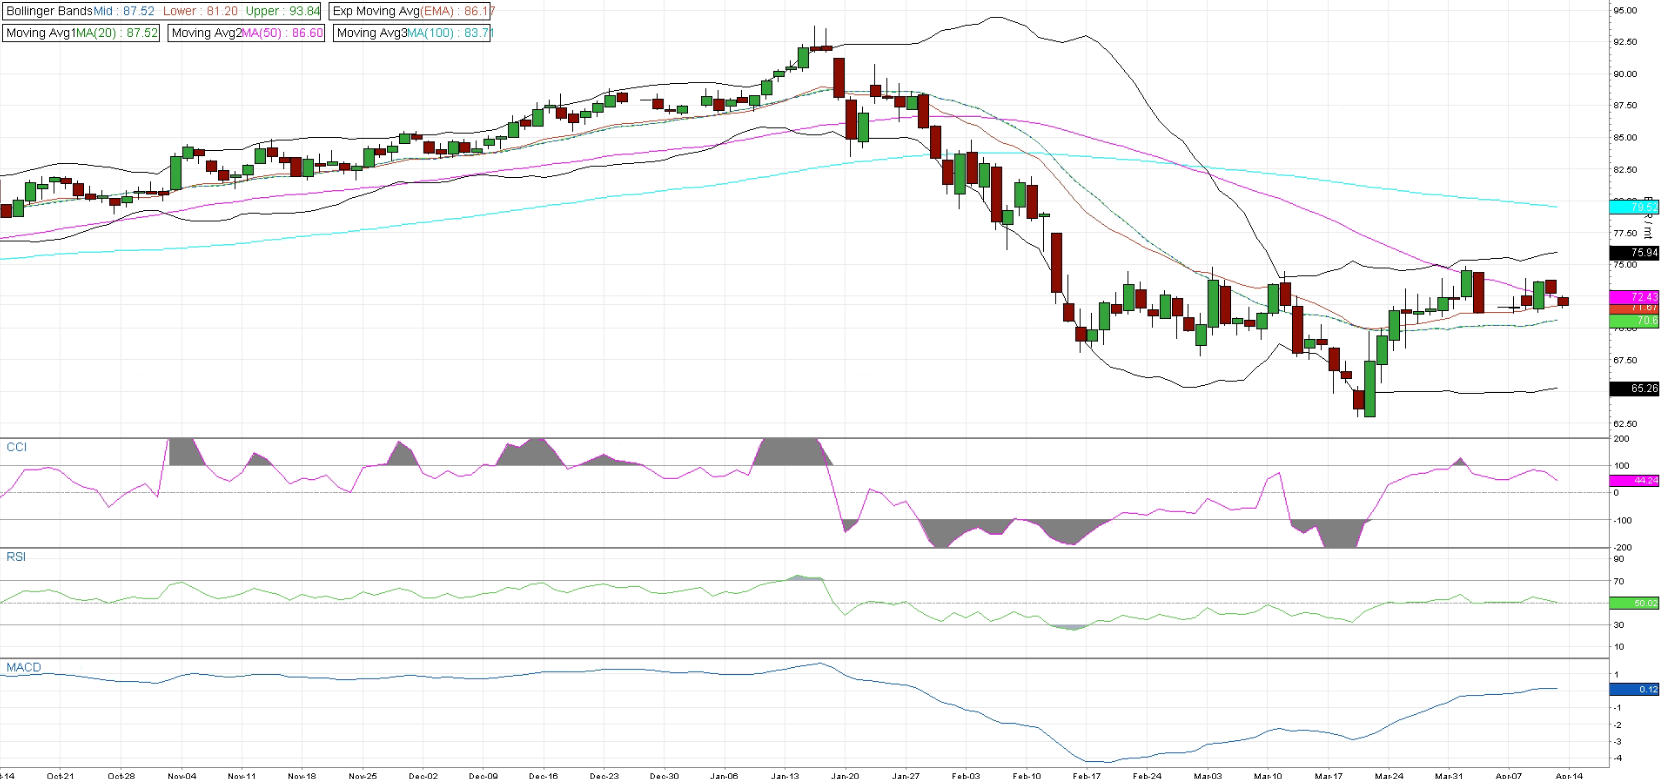
Dec26 rice action continues to stabilize after the earlier sell-off, with the market consolidating in the €70–73 range. The recovery from the €63–65 lows has lost some momentum, and price is now moving more sideways, suggesting a pause rather than a strong continuation higher. While short-term structure has improved compared to previous weeks, the broader trend still appears fragile with lower highs in place. The Bollinger Bands have narrowed, reflecting declining volatility after the sharp move lower. Price is trading around the mid-band, indicating a more balanced market environment. The upper band near €75–76 acts as immediate resistance, while the lower band near the mid €60s provides support. Moving averages remain mixed. Price is holding above the 20-day MA, which has flattened, signaling a loss of downside momentum. However, the 50-day MA (€72–73) is acting as resistance, and the 100-day MA (€80) remains well above current levels, confirming that the broader trend has not yet turned bullish. Momentum indicators are neutral. RSI is hovering around the 50 level, pointing to a lack of clear directional bias. CCI has eased back toward neutral territory after briefly turning positive, reflecting fading upside momentum. MACD has crossed into slightly positive territory and continues to rise gradually, suggesting that bearish momentum has weakened but without strong bullish confirmation.
The market is currently in a consolidation phase following the recent recovery. A break above the €73–75 resistance zone would strengthen the case for further upside, while failure to do so could keep price range-bound or expose it to renewed downside pressure. Overall, the technical picture is neutral with a slight recovery bias, but confirmation is still required for a more constructive trend.
Chart B: December 2026 EUA Price (EUR) - Technical
AFS ENERGY B.V.
The information contained in the AFS Energy EU ETS Report, hereinafter Report, has been compiled or arrived from sources believed to be reliable but no representation or warranty, express or implied, is made as to their accuracy, completeness, timeliness, correct sequencing or correctness.
AFS Energy B.V. does not accept any liability, contingent otherwise for (i) the accuracy, completeness, timeliness or correctness of any information provided in the Report, (ii) any decision made, or action taken by you in reliance upon any of them and (iii) any direct or consequential loss arising from the use of the Report. AFS Energy B.V. does not make any representation or warranty about the suitability of the information in the Report.
The information contained in the Report is published for the assistance of the recipient but is not to be relied upon as authoritative or taken in substitution for the exercise of judgement by any recipient.

