We collaborate to achieve sustainable success
A leading environmental solution provider
Get in touch with usAFS Energy EU ETS Market Report - Week 15 2026

Do you want to receive to-the-minute up to date info? Please sign up to our client portal and/or to the Viridian Exchange.
Energy Fundamentals
The fundamental outlook for EUA prices in the coming week remains mixed, with macro energy developments and ETS policy expectations pulling the market in different directions. On the supportive side, European gas storage remains low at 28.4%, which keeps concerns alive around energy security and the ability to refill inventories ahead of next winter. Higher gas and oil prices, particularly with oil remaining above $115 per barrel, can continue to support EUA prices as more expensive gas may encourage a shift back toward coal generation, increasing carbon emissions and therefore demand for allowances. The ongoing Iran conflict remains a key driver for energy markets. Continued risks around the Strait of Hormuz and uncertainty around oil and LNG flows are likely to keep volatility elevated across both gas and carbon markets. While reports that Iran is still allowing certain ships to transit the strait may ease some immediate fears, the broader geopolitical backdrop remains supportive for energy prices and could indirectly provide upward pressure on EUAs through higher fossil fuel burn. At the same time, ETS-related developments may limit upside potential. The confirmation of reforms to the Market Stability Reserve and free allocation benchmarks suggests policymakers remain focused on stability rather than aggressive tightening. Comments from Estonian officials that broader ETS changes are unnecessary may also reassure the market that there is limited appetite for a major structural overhaul. This could reduce some of the recent risk premium that had been building into EUA prices around fears of further supply tightening.
Overall, EUA prices may remain supported by stronger energy markets and coal-switching dynamics, but policy stability and the absence of more aggressive ETS reforms could cap the upside. This leaves the near-term outlook balanced, with a mild bullish bias as long as energy prices remain elevated.
- Gas storage currently sits at 28.4% (April 5th, 2026)
- Iran War’s Gas Supply Shock Pushes Top Consumers Back to Coal
- Donald Trump says US could ‘take the oil in Iran’
- Iran reportedly allows Spanish ships to transit Hormuz strait due to position on war
- Oil rises above $115 and Asia shares slide as Iran war enters fifth week
- Trump says he has ‘no problem’ with Russian oil tanker bringing relief to Cuba despite blockade
- Reform proposals of EU ETS supply reserve and free allocation benchmarks confirmed for Apr. 1
- Estonian minister: No need for more thorough Emissions Trading System changes
- The transition to climate neutrality can go hand-in-hand with sustainable public finances
- What the EU ETS upheaval means for investors
Investment Funds
- Investment funds decreased their net long position to +32.36m EUAs on March 27th (vs. +32.77 EUAs on March 20th).
- Gross short positions decreased to -41.89 EUAs (vs -48.67m EUAs).
- Gross long positions decreased to 74.25 mln EUAs (vs. 81.44m EUAs).
Market Prices
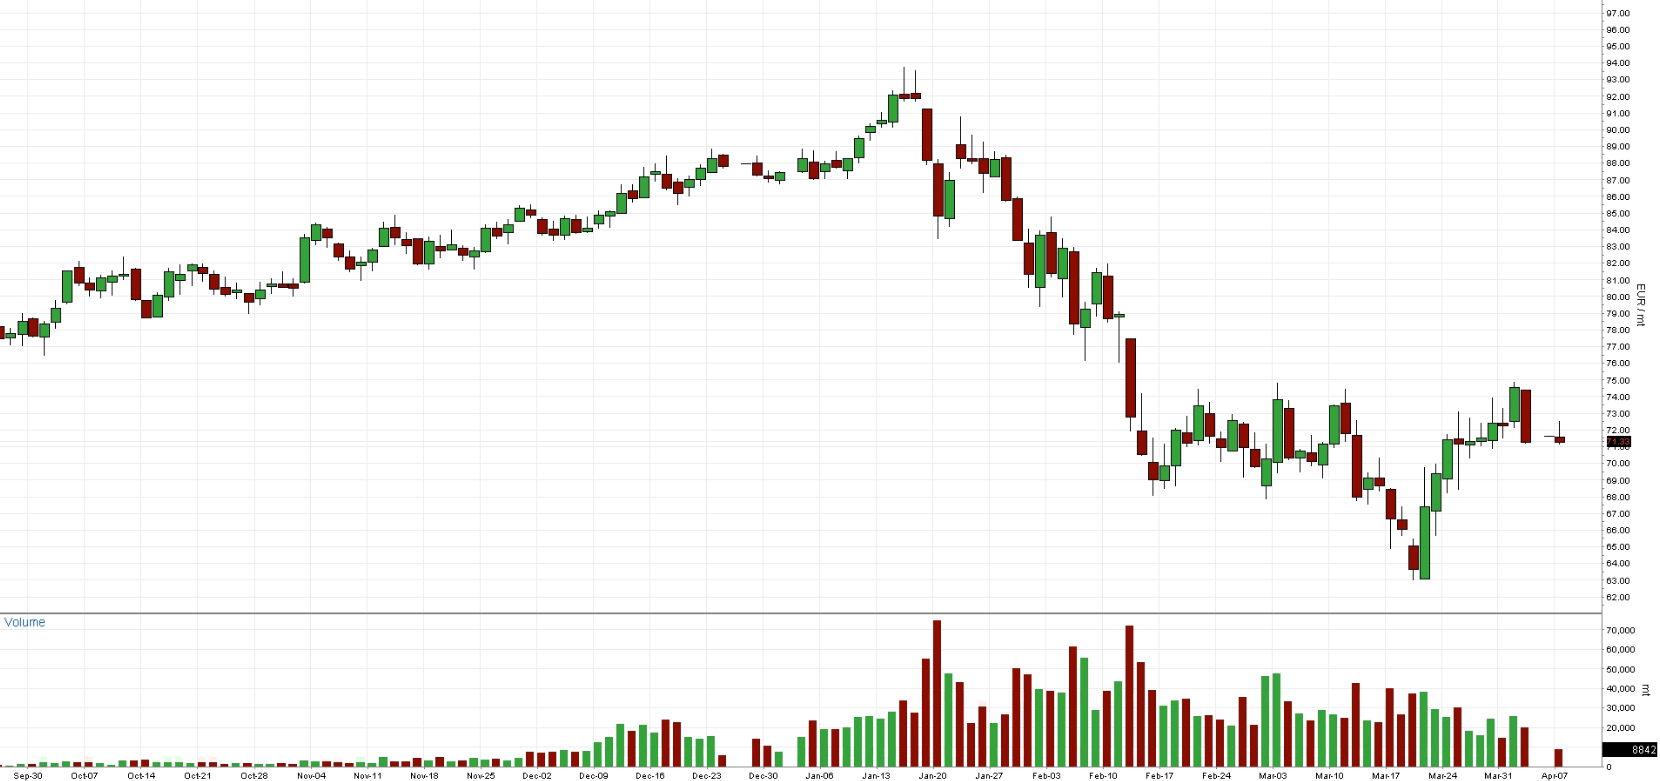
- Indicative Dec26 EUA Price: €71.40
- Indicative Spot EUA Price: €69.96
- YTD Spot EUA Price: €76.04
- MTD Spot EUA Price: €68.65
Chart A: December 2026 EUA Price (EUR)
Technical Analysis
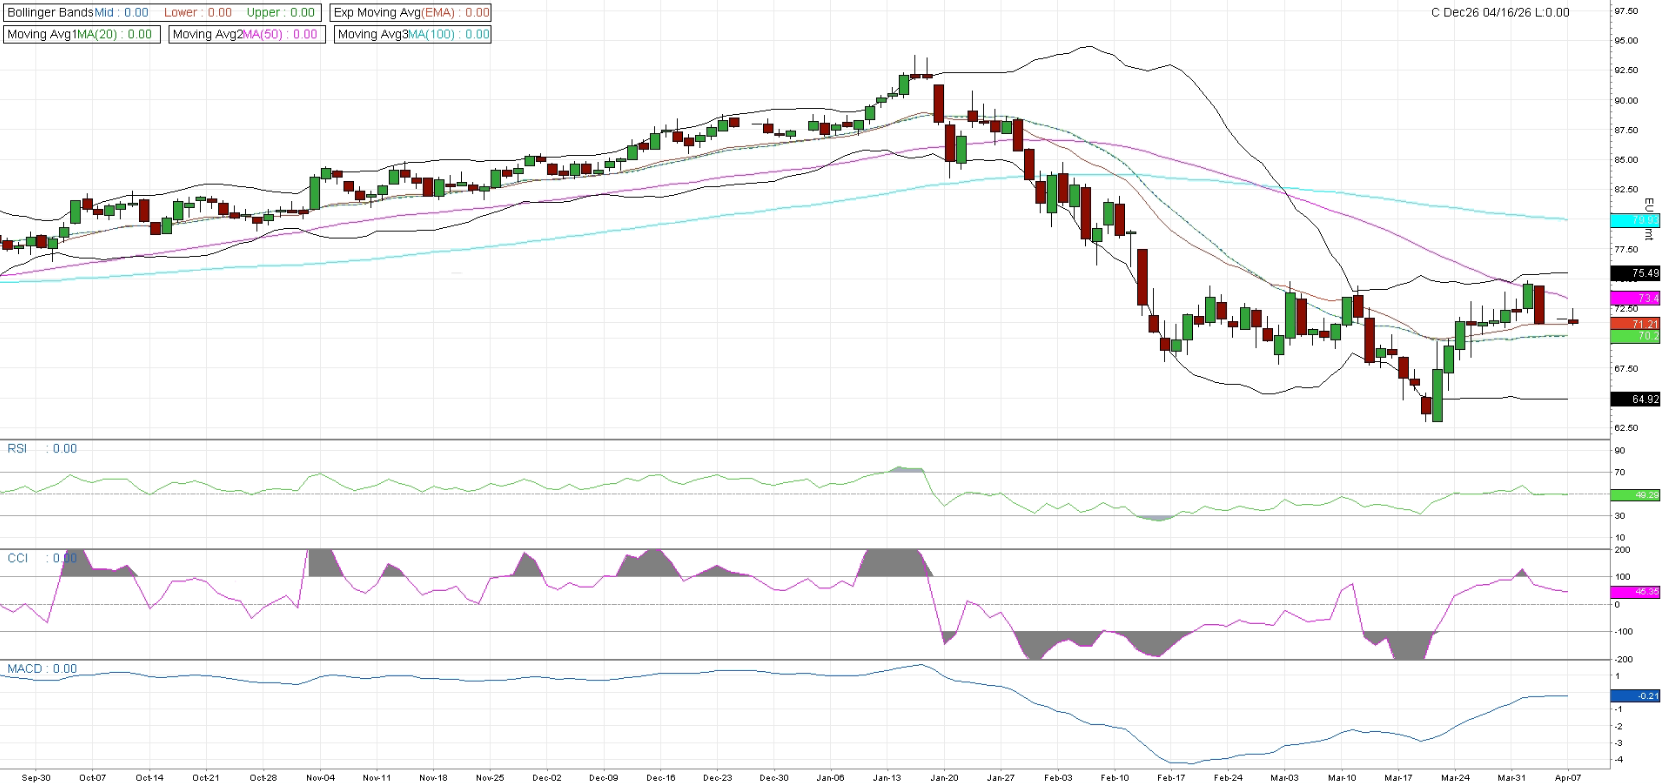
Dec26 price action has improved over recent sessions, with the market extending its recovery from the €64–65 lows toward the €73–75 area. This rebound has allowed price to move back above the short-term moving averages, suggesting that downside momentum is fading. However, the broader structure still remains cautious, as price continues to trade below the larger resistance zone created by the 50-day and 100-day moving averages. The Bollinger Bands have started to tighten following the earlier period of heavy downside volatility. Price is now trading around the middle-to-upper part of the recent range, indicating improving sentiment. The upper Bollinger Band near the €75 range is becoming the next important resistance area, and a move through that zone would likely strengthen the recovery trend. Moving averages are gradually becoming less bearish. The 20-day MA is flattening and beginning to turn higher, while price is trading above it. The 50-day MA near €73 remains an important hurdle, with the 100-day MA still much higher and reinforcing the broader bearish trend. As long as price can hold above the €70–71 zone, the short-term structure continues to improve. Momentum indicators are supportive. RSI has moved back above the neutral 50 area, suggesting stronger buying momentum. CCI has recovered firmly into positive territory, while MACD continues to rise from negative levels, indicating that bearish momentum is fading and that the market may be transitioning into a broader consolidation or recovery phase.
The short-term Dec26 outlook has improved, with the market building momentum above €70 and approaching the €73–75 resistance region. A sustained break above this area would strengthen the bullish case and could open the door toward higher levels. If price fails to break higher, the market may consolidate, though the recent recovery suggests downside pressure has eased compared with previous weeks.
Chart B: December 2026 EUA Price (EUR) - Technical
AFS ENERGY B.V.
The information contained in the AFS Energy EU ETS Report, hereinafter Report, has been compiled or arrived from sources believed to be reliable but no representation or warranty, express or implied, is made as to their accuracy, completeness, timeliness, correct sequencing or correctness.
AFS Energy B.V. does not accept any liability, contingent otherwise for (i) the accuracy, completeness, timeliness or correctness of any information provided in the Report, (ii) any decision made, or action taken by you in reliance upon any of them and (iii) any direct or consequential loss arising from the use of the Report. AFS Energy B.V. does not make any representation or warranty about the suitability of the information in the Report.
The information contained in the Report is published for the assistance of the recipient but is not to be relied upon as authoritative or taken in substitution for the exercise of judgement by any recipient.

