We collaborate to achieve sustainable success
A leading environmental solution provider
Get in touch with usAFS Energy EU ETS Market Report - Week 13 2026

Do you want to receive to-the-minute up to date info? Please sign up to our client portal and/or to the Viridian Exchange.
Auction volume: 9.23 million EUAs, 1.525 million less than last week.
Energy Fundamentals
The fundamental backdrop for European energy markets is tightening further and further, with storage levels now at 28.5% (March 20, 2026). This reinforces concerns around refill capacity ahead of next winter. With TTF opening above €60/MWh, high price levels continue to discourage injection activity, increasing the risk of a structural supply gap for the 2026–2027 winter season. The IEA’s warning of a potential “worst crisis in decades” underscores how fragile the balance has become, particularly as the market approaches a critical period for rebuilding inventories. Geopolitical risks remain a dominant driver. Escalating tensions around the Strait of Hormuz, including renewed threats from Iran and pressure from the U.S. to secure the passage, are keeping oil and LNG markets on edge. With a significant share of global LNG flows transiting through the region, fears of disruption are contributing to a persistent risk premium. At the same time, European policymakers are increasingly shifting toward intervention. While the EU Council has signaled that the ETS framework will remain in place, the door is clearly open for reforms, with discussions around price controls, subsidies, and tax cuts gaining traction. Von der Leyen’s openness to adjustments, combined with national-level measures such as Belgium’s direct electricity rebates and growing resistance from Italy and Poland, points to rising political pressure to shield consumers and industry from elevated energy costs. The introduction of mechanisms like the “ETS Investment Booster” and the IMO’s net-zero framework also suggests that carbon markets remain structurally important, even as short-term flexibility is being considered.
Overall, the market is caught between tightening physical fundamentals, elevated geopolitical risk, and increasing policy intervention. Supply-side uncertainty continues to support prices, while political efforts to cap or offset costs may limit the extent of further upside. This creates a highly volatile environment where both bullish supply risks and bearish policy responses remain in play.
- Gas storage currently sits at 28.5% (March 20th, 2026)
- The "ETS Investment Booster"
- IEA "Worst Crisis in Decades" Warning
- Gas & LNG: The "Hormuz Volunteers"
- World faces gas supply cliff edge as Gulf’s final LNG shipments approach ports
- Oil prices rise as Trump’s Hormuz ultimatum and Iran threats keep markets on edge
- IMO Net-Zero Framework Could Generate $11-12 Billion in Revenues
- EU Council: the ETS stands firm, but the way is open for changes
- Von der Leyen opens door to changing EU's emissions trading system
- EU eyes energy tax cuts, subsidies to ease Iran war impact
- Belgium (Flanders): Announced a plan on Sunday to bypass EU regulations and provide an immediate €50 rebate on all household electricity bills.
- Italy/Poland: Both governments intensified their rhetoric over the weekend, suggesting that if the "July 2026 ETS Reform" does not include a hard price cap, they may unilaterally suspend carbon compliance for their state-owned utilities.
Investment Funds
- Investment funds decreased their net long position to +35.2m EUAs on March 13th (vs. +52.36 EUAs on March 6th).
- Gross short positions increased to -53.6m EUAs (vs -41.44m EUAs).
- Gross long positions decreased to 88.8m EUAs (vs. 93.8m EUAs).
Market Prices
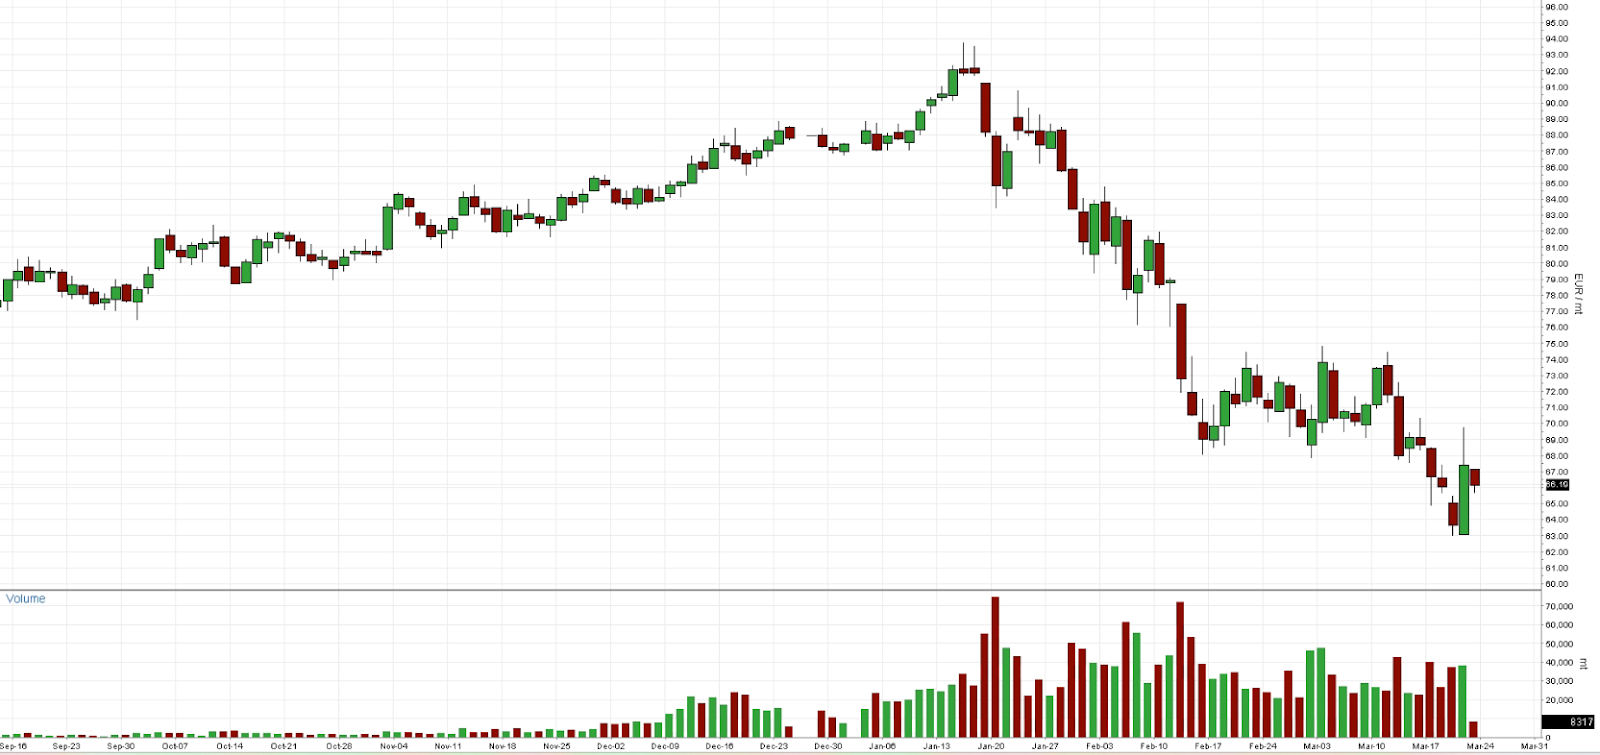
- Indicative Dec26 EUA Price: €66.74
- Indicative Spot EUA Price: €65.33
- YTD Spot EUA Price: € 76.97
- MTD Spot EUA Price: € 68.089
Chart A: December 2026 EUA Price (EUR)
Technical Analysis
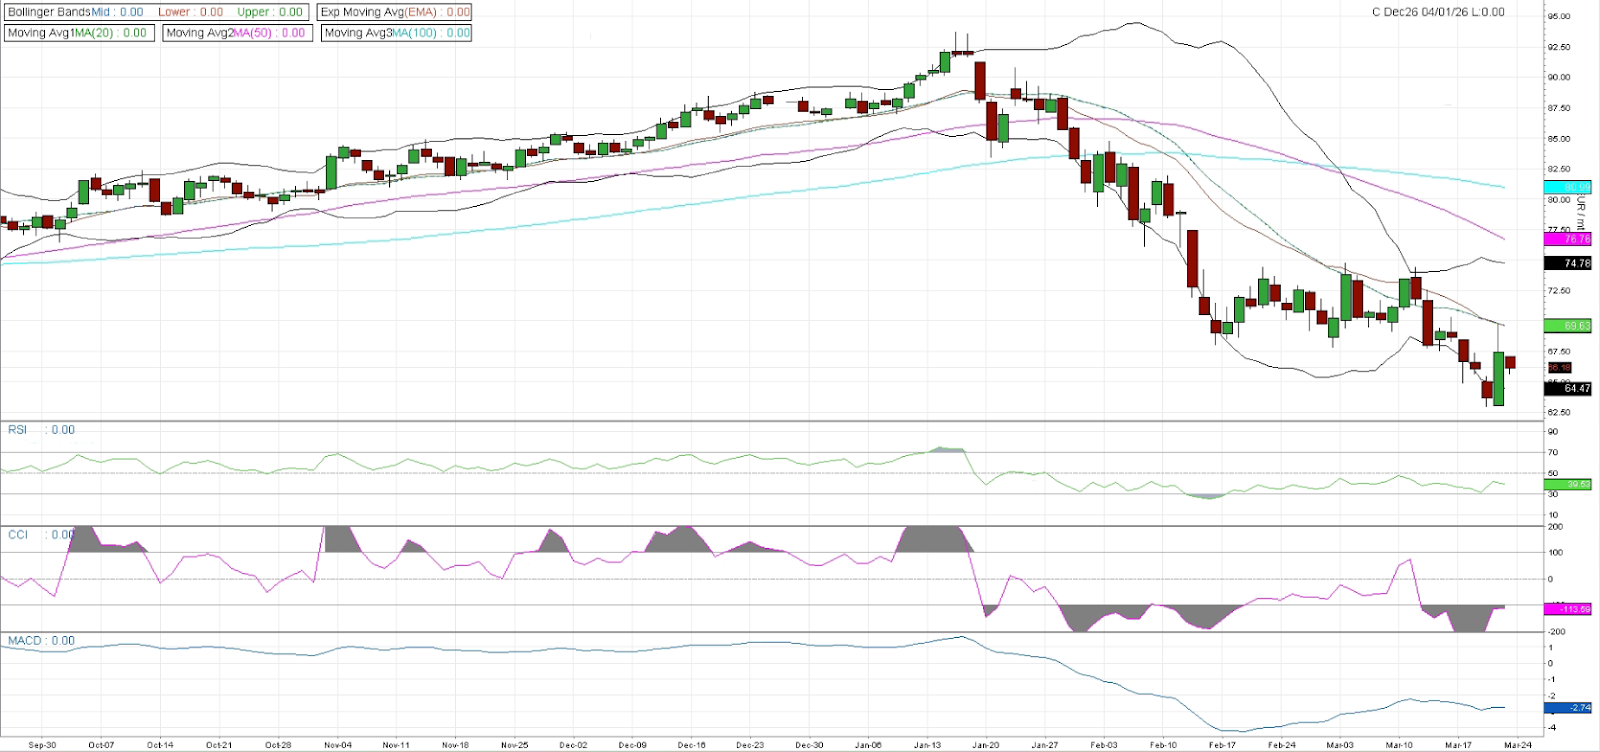
Price action remains firmly in a downtrend following the rejection from the Q1 highs, with a continued sequence of lower highs and lower lows. The recent move toward the €64–65 region marks a fresh leg lower, indicating confirmation of bearish momentum control. Meanwhile a small bounce is developing whilst the price is still trading well below prior structure. This again suggests the move is corrective rather than a confirmed reversal. The Bollinger Bands expanded during the sell-off, reflecting strong downside volatility and persistent pressure. Price has consistently traded near the lower band, indicating a stretched market. Recently, bands have started to compress slightly as price stabilizes. The mid-band near €68 remains the first key resistance and would need to be reclaimed to signal improving upward momentum. Moving averages continue to reinforce the bearish structure. The 20-day MA is trending lower, with the 50-day and 100-day MAs positioned above price, creating a layered resistance zone between roughly €70 and €80. Momentum indicators show early signs of stabilization but remain weak overall. RSI has recovered slightly from oversold territory but remains below 50, while MACD is still negative, though flattening. This would again suggest downside momentum is slowing rather than reversing. Notably, recent price action reflects fundamental-driven volatility. The market moved lower on speculation around potential ETS easing, but Friday’s bounce suggests a partial reversal after the outcome proved less accommodative than expected.
The structure remains bearish, but indications of short term stabilization are emerging. A move toward €70–75 could test resistance, while failure to hold current levels would keep downside pressure intact.
Chart B: December 2026 EUA Price (EUR) - Technical
AFS ENERGY B.V.
The information contained in the AFS Energy EU ETS Report, hereinafter Report, has been compiled or arrived from sources believed to be reliable but no representation or warranty, express or implied, is made as to their accuracy, completeness, timeliness, correct sequencing or correctness.
AFS Energy B.V. does not accept any liability, contingent otherwise for (i) the accuracy, completeness, timeliness or correctness of any information provided in the Report, (ii) any decision made, or action taken by you in reliance upon any of them and (iii) any direct or consequential loss arising from the use of the Report. AFS Energy B.V. does not make any representation or warranty about the suitability of the information in the Report.
The information contained in the Report is published for the assistance of the recipient but is not to be relied upon as authoritative or taken in substitution for the exercise of judgement by any recipient.

