We collaborate to achieve sustainable success
A leading environmental solution provider
Get in touch with usAFS Energy EU ETS Market Report - Week 11 2026

Do you want to receive to-the-minute up to date info? Please sign up to our client portal and/or to the Viridian Exchange.
Energy Fundamentals
The fundamental backdrop for energy markets is increasingly shaped by geopolitical tension alongside evolving supply and demand dynamics. European gas storage currently stands at 29.4% as of March 7, 2026, leaving inventories relatively tight compared with seasonal norms. At the same time, the geopolitical risk premium has risen sharply following the appointment of Mojtaba Khamenei as Iran’s new leader, which has heightened uncertainty in the Middle East and contributed to concerns over disruptions to global oil and gas flows. Energy markets are reacting strongly to these developments. Oil prices have surged, while European gas futures jumped nearly 30% as the crisis in the Middle East deepened. The strategic importance of the region’s shipping routes and energy production infrastructure means further escalation could quickly tighten global supply conditions. In response to rising risks, G-7 countries are reportedly discussing the potential use of joint emergency oil reserves, highlighting the level of concern. On the demand side, weather conditions may offer some short-term relief. Forecasts for above-seasonal temperatures across Europe could moderate heating demand and temporarily ease pressure on gas consumption. Meanwhile, energy policy discussions within the European Union remain active, with seven EU ministers urging the European Commission to maintain current energy pricing rules while accelerating investment in clean power capacity. These debates reflect the ongoing balancing act between energy security, affordability, and the longer-term transition toward lower-carbon energy systems.
Overall, the market environment remains highly sensitive to geopolitical headlines. Supply risk in the Middle East is currently the dominant driver of price volatility, while weather patterns and policy responses in Europe will likely shape near-term demand expectations and market sentiment.
- Gas storage currently sits at 29.4% (March 7th, 2026)
- Khamenei's hardline son Mojtaba appointed Iran's new leader
- Oil surges on supply fears
- European gas futures jump 30% as Middle East Crisis deepens
- G-7 to Discuss Joint Emergency Oil Reserves
- Above the season temperatures predicted for Europe
- Seven EU ministers ask Commission to keep rules on energy pricing and invest more in clean power
Investment Funds
- Investment funds decreased their net long position to +63.25m EUAs on February 27th (vs. +68.83 EUAs on February 20th).
- Gross short positions increased to -36.62m EUAs (vs -33.36m EUAs).
- Gross long positions decreased to 99.88m EUAs (vs. 102.19m EUAs).
Market Prices
- Indicative Dec26 EUA Price: € 70.17
- Indicative Spot EUA Price: € 68.69
- YTD Spot EUA Price: € 79.08
- MTD Spot EUA Price: € 69.726
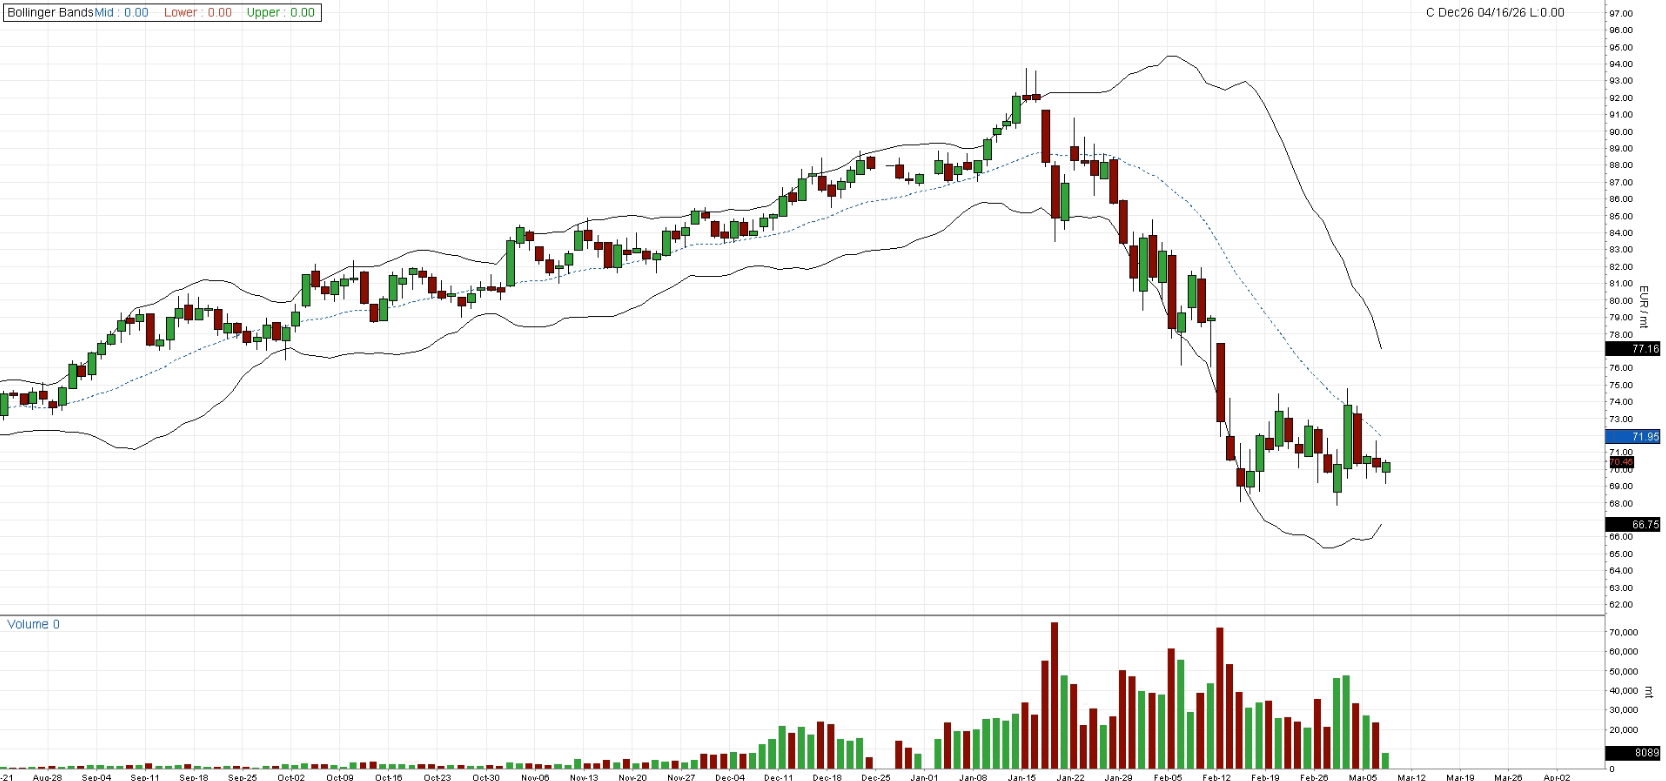
Chart A: December 2026 EUA Price (EUR)
Technical Analysis
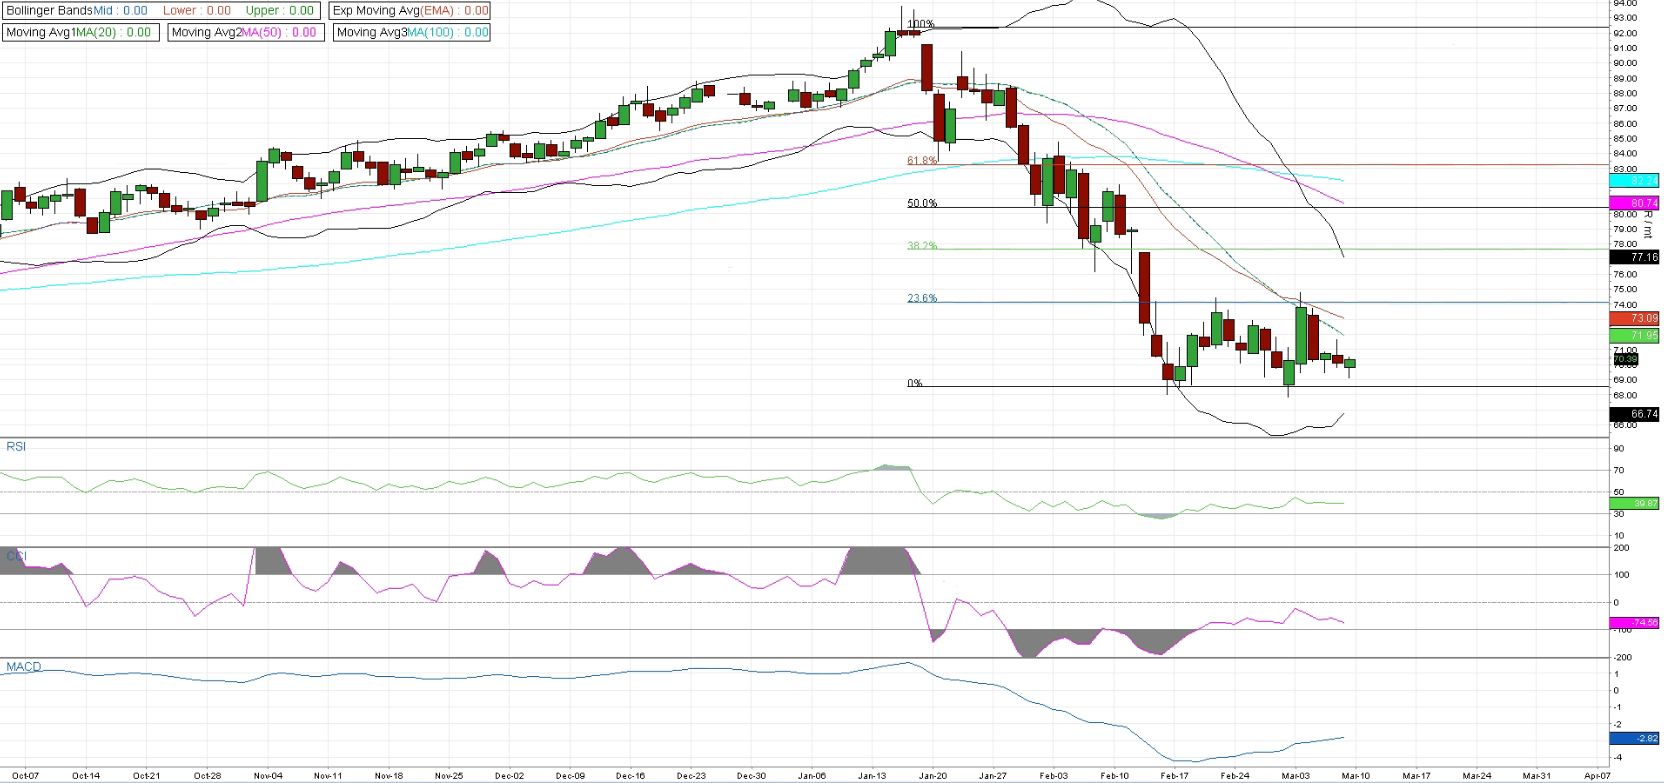
Price action remains under pressure following the sharp breakdown from the highs near the 100% Fibonacci level. The market continues to trade well below the key moving averages. After the impulsive sell-off toward the €69 area, price has entered a consolidation phase slightly above the 0% Fibonacci retracement, suggesting short-term stabilization but not yet a confirmed structural reversal. Price repeatedly tested the lower bollinger band during the sell-off before starting to move sideways. Recently, the bollingers have begun to compress slightly as price consolidates near the lower range. The mid-band, currently near the €72 zone, remains the first meaningful resistance level and would need to be reclaimed to signal improving momentum. Moving averages continue to provide a bearish indication to the structure. The 20-day moving average is trending downward and sits above current price levels, while the 50-day and 100-day averages remain even higher, creating a layered resistance zone. From a Fibonacci perspective, the recent rebound remains limited. Price is currently hovering around the 0–23.6% retracement zone, with the 23.6% level near €74 acting as the first resistance barrier. Above that, the 38.2% retracement near €77 and the 50% level around €80 represent progressively stronger resistance levels that coincide with the declining moving averages. Momentum indicators suggest downside pressure is easing but not yet reversing. RSI has recovered slightly from oversold territory and is hovering near the neutral 40 level. CCI remains negative, consistent with the recent corrective environment, while MACD is still below the zero line but beginning to flatten, all indicators of stabilization but not a shift to bullish momentum.
The €69–70 zone continues to act as an important support base, while the €73–77 area represents the first meaningful resistance band. A sustained break above this region would improve the short-term outlook and open the door for a broader recovery toward €80 and higher. Conversely, failure to build momentum and a renewed break below €69 would likely reinforce the broader downtrend and reopen downside risk.
Chart B: December 2026 EUA Price (EUR) - Technical
AFS ENERGY B.V.
The information contained in the AFS Energy EU ETS Report, hereinafter Report, has been compiled or arrived from sources believed to be reliable but no representation or warranty, express or implied, is made as to their accuracy, completeness, timeliness, correct sequencing or correctness.
AFS Energy B.V. does not accept any liability, contingent otherwise for (i) the accuracy, completeness, timeliness or correctness of any information provided in the Report, (ii) any decision made, or action taken by you in reliance upon any of them and (iii) any direct or consequential loss arising from the use of the Report. AFS Energy B.V. does not make any representation or warranty about the suitability of the information in the Report.
The information contained in the Report is published for the assistance of the recipient but is not to be relied upon as authoritative or taken in substitution for the exercise of judgement by any recipient.

