We collaborate to achieve sustainable success
A leading environmental solution provider
Get in touch with usAFS Energy EU ETS Market Report - Week 10 2026

Do you want to receive to-the-minute up to date info? Please sign up to our client portal and/or to the Viridian Exchange.
Energy Fundamentals
The macro backdrop is currently dominated by geopolitical risk layered on top of already tight energy fundamentals. European gas storage sits at 30% (Feb 28, 2026), leaving the region relatively exposed to supply shocks. Escalating tensions near the Strait of Hormuz, including vessel attacks and a drone strike on Saudi Aramco’s Ras Tanura refinery, have increased concerns over global oil and LNG flows. European gas prices have already jumped 25% on fears that disruption in the region could materially impact supply chains. Oil markets are balancing risk and supply dynamics. While geopolitical tensions are supporting prices near the $80 level, OPEC+ plans to boost production from April, which could partially offset disruption risks if volumes materialize as expected. As a result, the market is pricing in a risk premium, but not yet a full supply crisis. Meanwhile, carbon markets are under political pressure. EU carbon prices have fallen as several member states push for ETS reform to protect competitiveness, with Italy even calling for a suspension of the carbon price. The inclusion of ETS allowance clauses in maritime contracts further embeds carbon costs into shipping, but growing policy debate suggests potential recalibration ahead.
Overall, energy markets remain headline-driven and volatile, with geopolitical risk supporting prices while policy and supply responses attempt to contain structural upside.
- Gas storage currently sits at 30.00% (February 28th, 2026)
- ETS Allowances Clause for BARECON adopted at BIMCO Documentary Committee meeting
- Oil prices rise after ships attacked near Strait of Hormuz
- Oil to hold near $80 amid Strait of Hormuz threats - Analyst
- Saudi Aramco shuts Ras Tanura refinery after drone strike, source says
- OPEC+ to Boost Oil Production From April
- Secretary-General of the International Maritime Organization Mr. Arsenio Dominguez has issued a statement on the situation in the Strait of Hormuz:
- European Gas Jumps 25% as Iran Crisis Threatens Global Flows
- EU economy minister group call for ETS revision to prioritise competitiveness
- Italy calls for suspension of carbon price in major attack on EU climate policy
- EU carbon prices tumble as major states add to ETS reform calls
Investment Funds
- Investment funds decreased their net long position to +68.83m EUAs on February 13th (vs. +82.41 EUAs on February 13th).
- Gross short positions increased to -33.36m EUAs (vs -26.51m EUAs).
- Gross long positions decreased to 102.19m EUAs (vs. 108.92m EUAs).
Market Prices
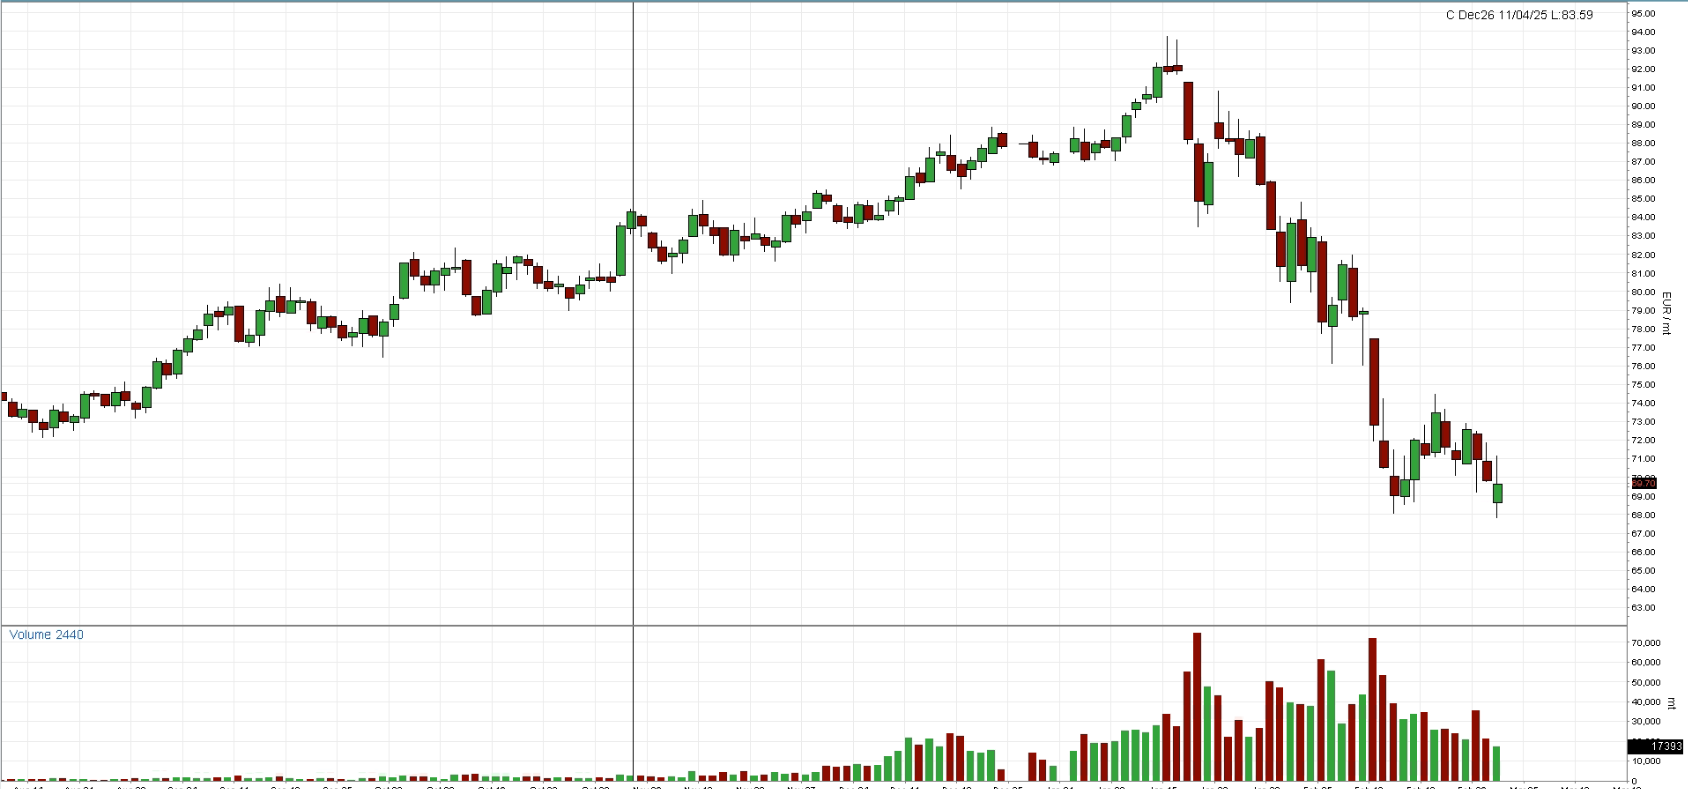
- Indicative Dec26 EUA Price: € 69.90
- Indicative Spot EUA Price: € 68.58
- YTD Spot EUA Price: € 80.22
- MTD Spot EUA Price: € 73.51
Chart A: December 2026 EUA Price (EUR)
Technical Analysis
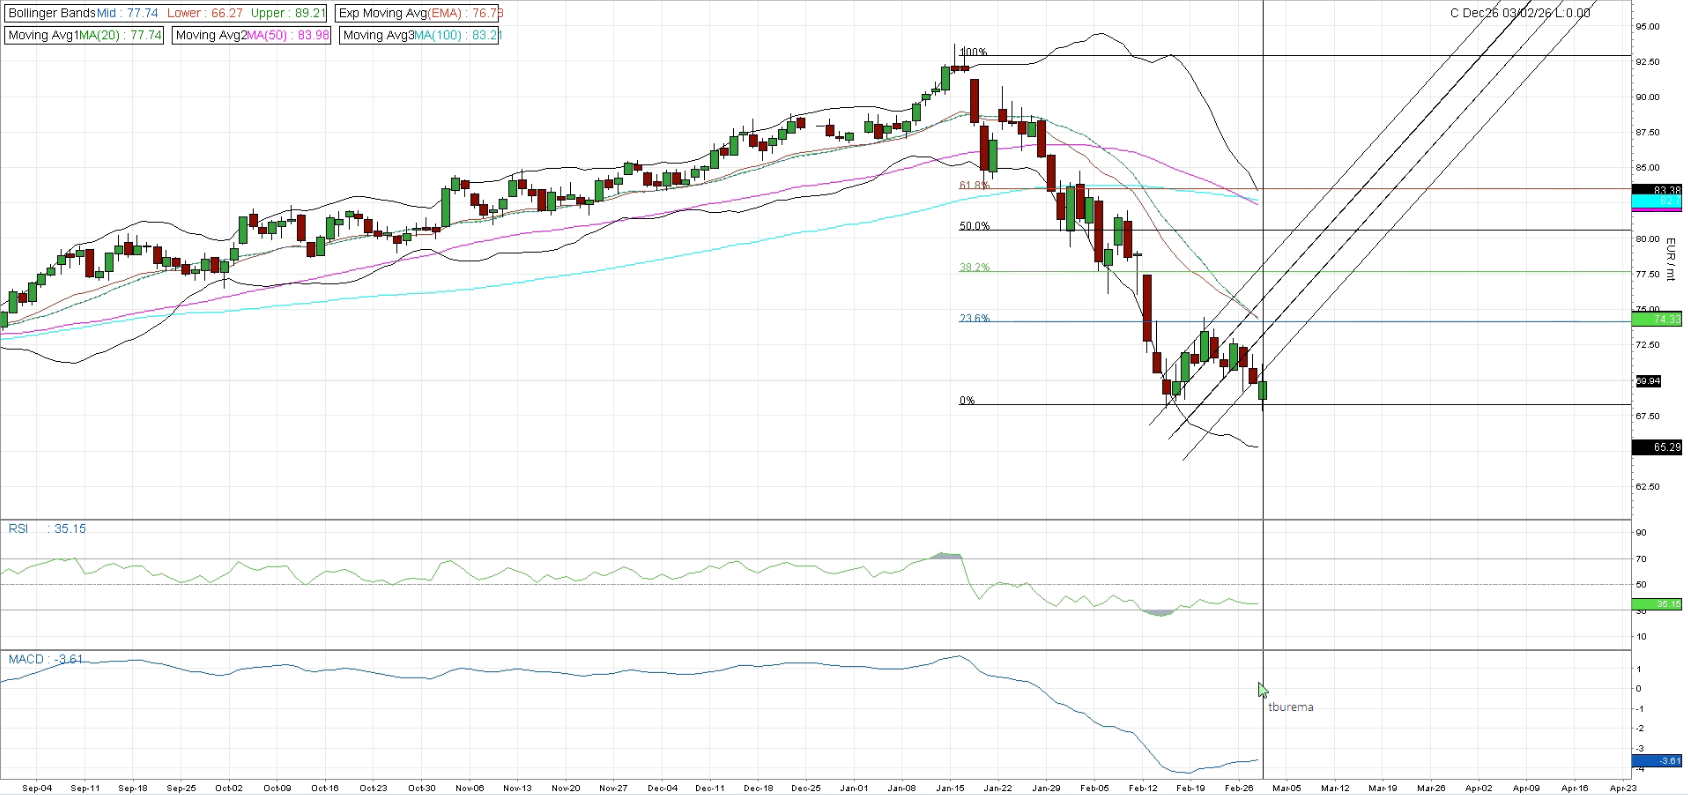
Dec26 price remains within a broader downtrend after topping near the 100% Fibonacci level, marked by a clear sequence of lower highs and lower lows. However, the recent stabilization around the €69–70 zone is technically significant. Price has now tested this area twice, forming a potential double bottom structure. This creates a possible basing pattern, with the interim high around €74–75 acting as the neckline. A sustained break above that neckline would shift the short-term structure from corrective rebound to potential trend reversal. The Bollinger Bands expanded aggressively during the sell-off, reflecting strong downside momentum. Price repeatedly tagged the lower band before reverting toward the mid-band near €77. Volatility is now compressing, which often precedes a directional move. A decisive push above the mid-band would support the double bottom thesis, while rejection would keep pressure intact. Moving averages remain bearishly aligned, with the 20-day MA sloping downward and the 50-day and 100-day MAs positioned above price. The 50% Fibonacci level near €81 and the 61.8% retracement around €84 coincide with this moving average cluster, forming a heavy resistance zone. However, if the neckline near €74–75 breaks convincingly, it opens room toward the 38.2% retracement near €77 as the next upside target. Momentum is stabilizing. RSI has recovered from oversold conditions and is gradually improving, suggesting selling pressure is fading. MACD remains negative but is flattening, indicating downside momentum is decelerating, often an early precursor to base formation.
The broader trend remains technically bearish, but the developing double bottom introduces a constructive element. A confirmed break above the €74–75 neckline would materially improve the outlook and increase the probability of a broader bullish recovery phase toward the €77 zone. Failure to break the neckline, however, would likely invalidate the bullish setup and reopen downward sentiment.
Chart B: December 2026 EUA Price (EUR) - Technical
AFS ENERGY B.V.
The information contained in the AFS Energy EU ETS Report, hereinafter Report, has been compiled or arrived from sources believed to be reliable but no representation or warranty, express or implied, is made as to their accuracy, completeness, timeliness, correct sequencing or correctness.
AFS Energy B.V. does not accept any liability, contingent otherwise for (i) the accuracy, completeness, timeliness or correctness of any information provided in the Report, (ii) any decision made, or action taken by you in reliance upon any of them and (iii) any direct or consequential loss arising from the use of the Report. AFS Energy B.V. does not make any representation or warranty about the suitability of the information in the Report.
The information contained in the Report is published for the assistance of the recipient but is not to be relied upon as authoritative or taken in substitution for the exercise of judgement by any recipient.

