We collaborate to achieve sustainable success
A leading environmental solution provider
Get in touch with usAFS Energy EU ETS Market Report - Week 1 2026

Do you want to receive to-the-minute up to date info? Please sign up to our client portal and/or to the Viridian Exchange.
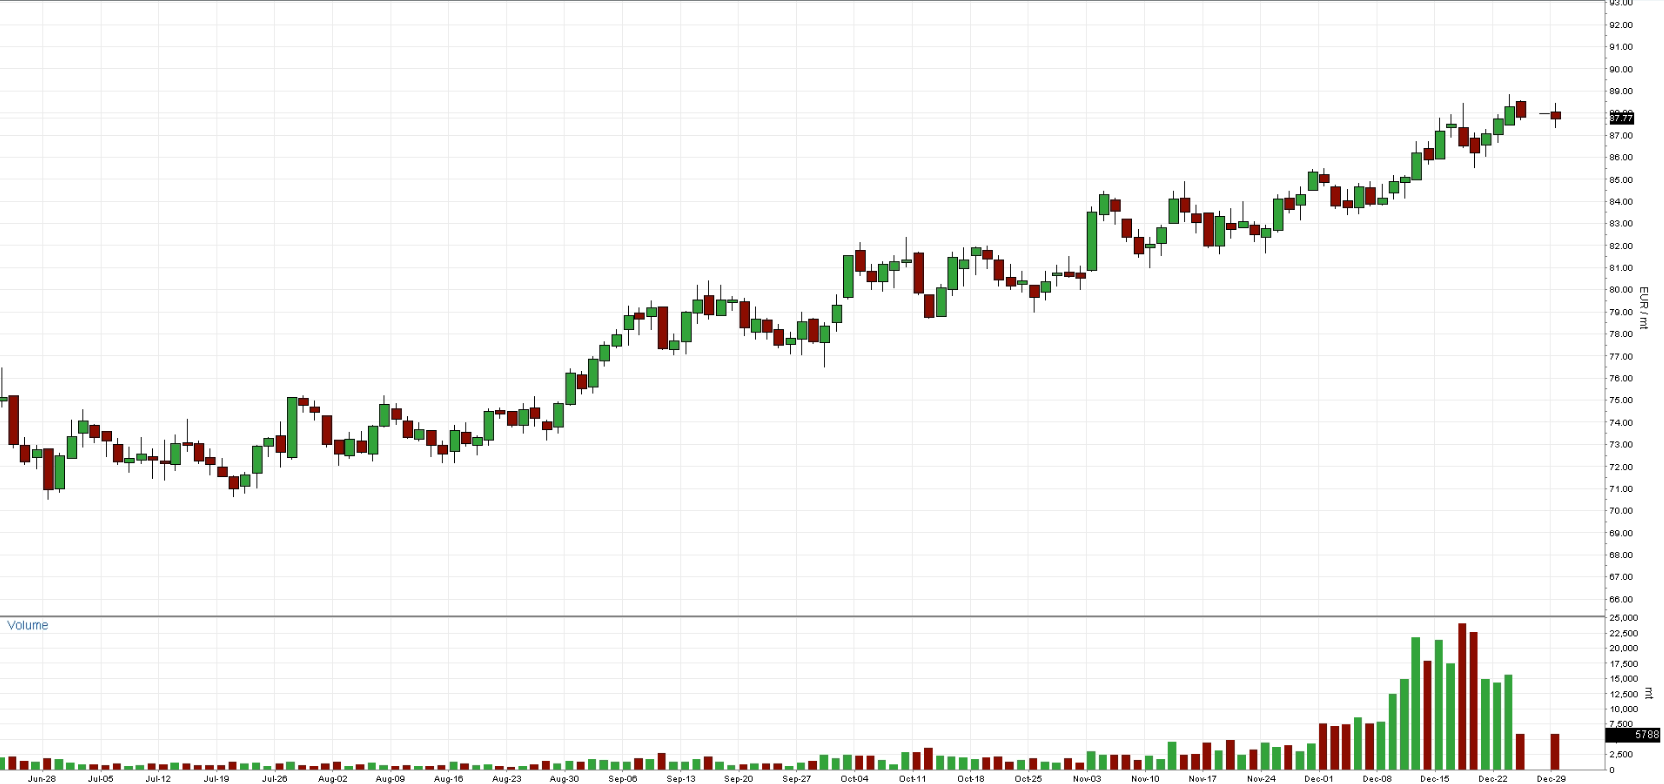
Last week, EUAs rose 0.9% from Monday’s open (87.05) to Wednesday’s close (87.86); weekly high (88.88)/ low (86.71) spread was €2.17.
European gas fundamentals remain finely balanced, with storage levels at 64% by December 26 — still adequate, but increasingly sensitive to weather-driven demand. Colder air returning to Europe late December, with a dynamic pattern extending into early 2026, introduces a potential tightening bias, particularly if cold spells prove more persistent than currently anticipated. However, thin holiday trading may amplify short-term moves without reflecting a clear underlying trend. Geopolitical signals remain mixed. China’s drills around Taiwan add a layer of broader macro uncertainty, while reported progress toward a Russia–Ukraine peace deal could, if sustained, gradually ease longer-term supply risk perceptions. For now, these narratives largely offset each other, limiting near-term directional clarity. In the emissions market, EUA prices continue to trade in a supply vacuum, with auctions paused until January 7. This may provide short-term support, but participation remains subdued due to seasonal inactivity. Overall, downside appears cushioned by weather and temporary supply tightness, while upside remains constrained by adequate inventories, geopolitical ambiguity, and low liquidity. Market direction remains open-ended, with weather and liquidity likely to dominate price action until normal trading resumes in early January.
Auction volume: None until 2026
Energy Fundamentals
- Gas storage currently sits at 64% (Dec 26, 2025)
- China launches drills around Taiwan in ‘stern warning’ to external forces
- Trump, Zelenskyy hail progress towards Russia-Ukraine peace deal
- Colder Air Pushes Back into Europe Late December, Dynamic Pattern Continues into 2026
- EUA market remains in Supply Vacuum as auctions are paused until the 7th of January
- Market is thinly traded due to seasonality and Holidays
Investment Funds
- Investment funds increased their net long position to +117.57m EUAs on December 19th (vs. +114.34m EUAs on December 5th).
- Gross short positions slightly decreased to -27.03m EUAs (vs -27.84m EUAs).
- Gross long positions increased to 144.60m EUAs (vs. 141.87m EUAs).
Market Prices:
- Indicative Dec26 EUA Price: € 87.75
- Indicative Spot EUA Price: €85.58
- YTD Spot EUA Price: € 73.952
- MTD Spot EUA Price: € 81.523
Chart A: December 2025 EUA Price (EUR)
Technical Analysis
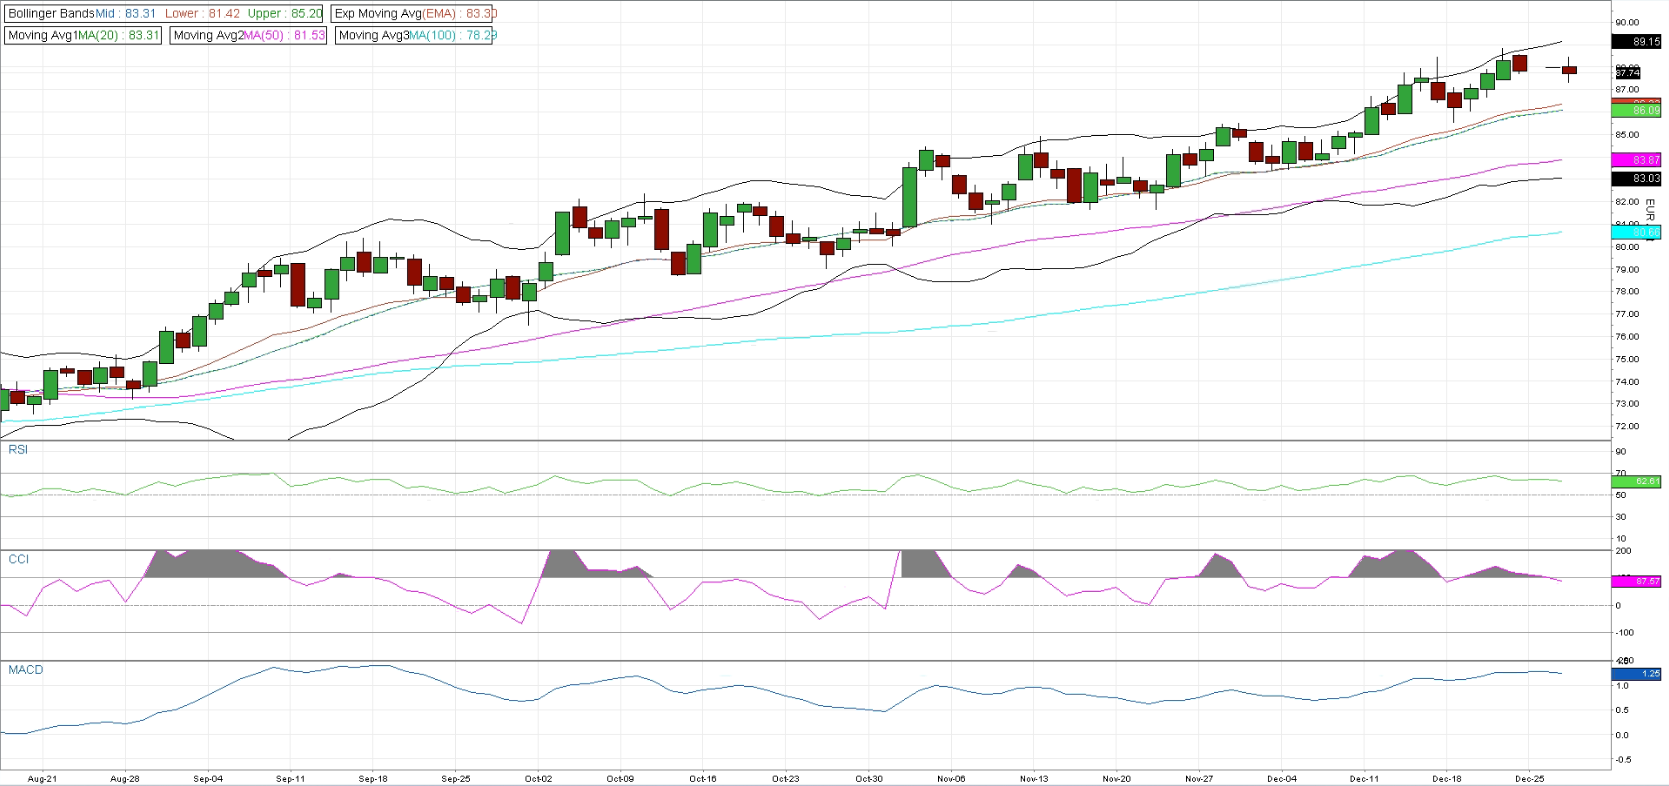
Price action remains constructive, with the market holding comfortably above the 20-day EMA (83.3) and well supported by the 50-day MA (81.5). The broader trend structure stays intact, as the 100-day MA (78.2) continues to slope higher and remains far below spot, indicating that medium-term momentum can still be considered firmly positive. The Bollinger Bands are moderately expanded, with price trading in the upper half of the range. This reflects persistent bullish pressure, though not an outright momentum squeeze. A drift back toward the mid-band would not damage the trend and could even reset conditions for another leg higher. Momentum indicators remain supportive but are no longer stretched. RSI (62) sits comfortably above neutral, pointing to underlying strength without flashing overbought warnings. CCI (88) has cooled slightly from recent peaks, hinting at short-term digestion rather than trend exhaustion. Meanwhile, MACD remains positive and gently rising, reinforcing the view that upside momentum is still present, albeit at a more controlled pace.
The technical picture leans mildly bullish, with the trend clearly intact, but momentum is transitioning from expansion into consolidation. As long as price holds above the short-term moving averages, upside attempts remain plausible, while near-term pullbacks look corrective rather than trend-changing.
Chart B: December 2025 EUA Price (EUR) - Technical
AFS ENERGY B.V.
The information contained in the AFS Energy EU ETS Report, hereinafter Report, has been compiled or arrived from sources believed to be reliable but no representation or warranty, express or implied, is made as to their accuracy, completeness, timeliness, correct sequencing or correctness.
AFS Energy B.V. does not accept any liability, contingent otherwise for (i) the accuracy, completeness, timeliness or correctness of any information provided in the Report, (ii) any decision made, or action taken by you in reliance upon any of them and (iii) any direct or consequential loss arising from the use of the Report. AFS Energy B.V. does not make any representation or warranty about the suitability of the information in the Report.
The information contained in the Report is published for the assistance of the recipient but is not to be relied upon as authoritative or taken in substitution for the exercise of judgement by any recipient.

